

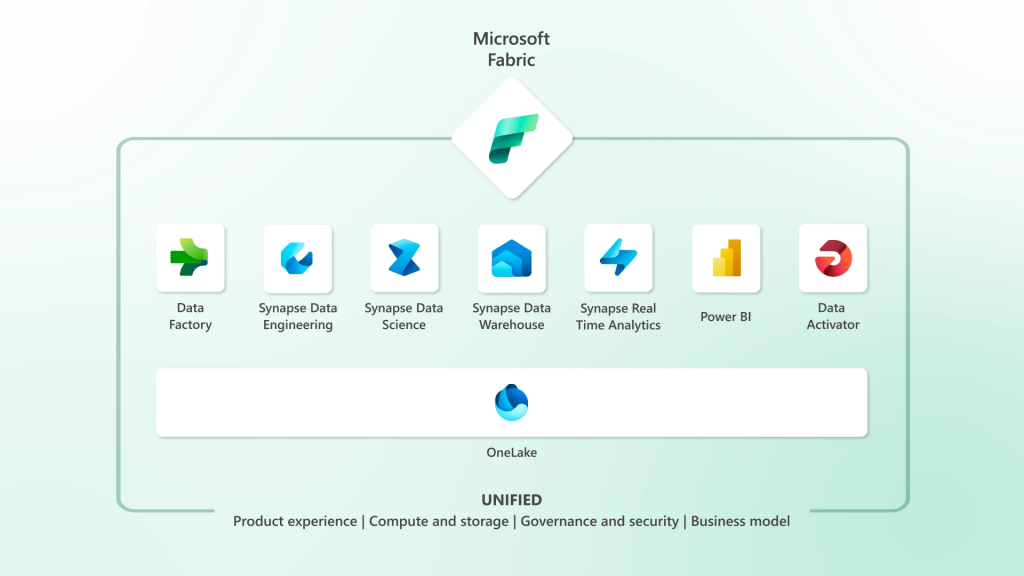
There’s been an exciting new announcement at Microsoft Build in the form of Microsoft Fabric, a unified platform that brings together Data Engineering, Data Warehousing, Data Science, Real-time analytics, and Power BI. It’s an evolution of Azure Synapse Analytics and Power BI from their current forms. You can read the announcement here.
Relevant Links
- Trial: Microsoft Fabric
- Community site: Home – Microsoft Fabric Community
- Ideas: Home (microsoft.com)
- Product website: Introducing Microsoft Fabric: The data platform for the era of AI | Azure Blog | Microsoft Azure
- Documentation: Microsoft Fabric documentation – Microsoft Fabric | Microsoft Learn
- Blog: Microsoft Fabric Blog
- Learn modules: Get started with Microsoft Fabric – Training | Microsoft Learn
- End-to-end scenario tutorials: End-to-end tutorials in Microsoft Fabric – Microsoft Fabric | Microsoft Learn
I’m been lucky enough to be on the private preview for the last few months and have been hands on with Fabric and it’s various features, so I wanted to put together a getting started blog to go through enabling Fabric and creating a (very basic) solution. There’s so much to Fabric and I can’t do it justice in a single blog post, but I hope it’s useful just to get you started.
Please note that Microsoft Fabric, like any data platform, still needs to be implemented with due diligence around architecture, development practices, security, and governance in mind.
There’s going to be a lot of info about Fabric in the coming days and weeks from Microsoft themselves and from the data community, so strap in as there’s a lot to cover. But if you’re like me and you just love to dive right in and have a play around and look at details later, well good news because you can enable Fabric and start a 60 day trial in a Power BI tenant that just has a single Pro license. So if you have a Pro license then you can get started for free. Note that Fabric is disabled by default…probably a good thing as I’m sure there’s plenty of Power BI admins out there who don’t want all these features on by default.
After the 60 day trial a Fabric capacity will need to be purchased (if you don’t already have a Power BI Premium capacity), this can be done via the Azure portal and capacities start at £260 a month (well, in my currency GBP).
In this blog we’ll look at how to get started with Microsoft Fabric, create a lakehouse then use the SQL endpoint to build a Power BI report. I know there’s a lot to cover and over the coming days and weeks there will be a lot of information coming about the Fabric concepts so stay tuned!
Enabling Fabric
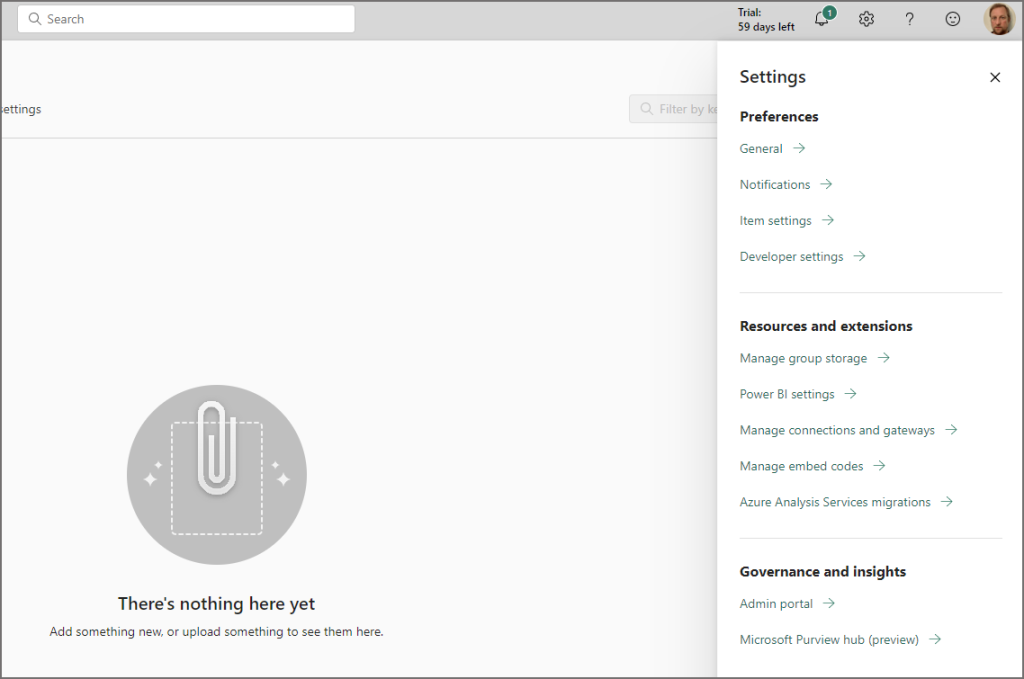
The first thing to do is login to your existing Power BI tenant at https://app.powerbi.com and click on the Settings in the top-right, you can then select Admin Portal under the Governance and insights section.
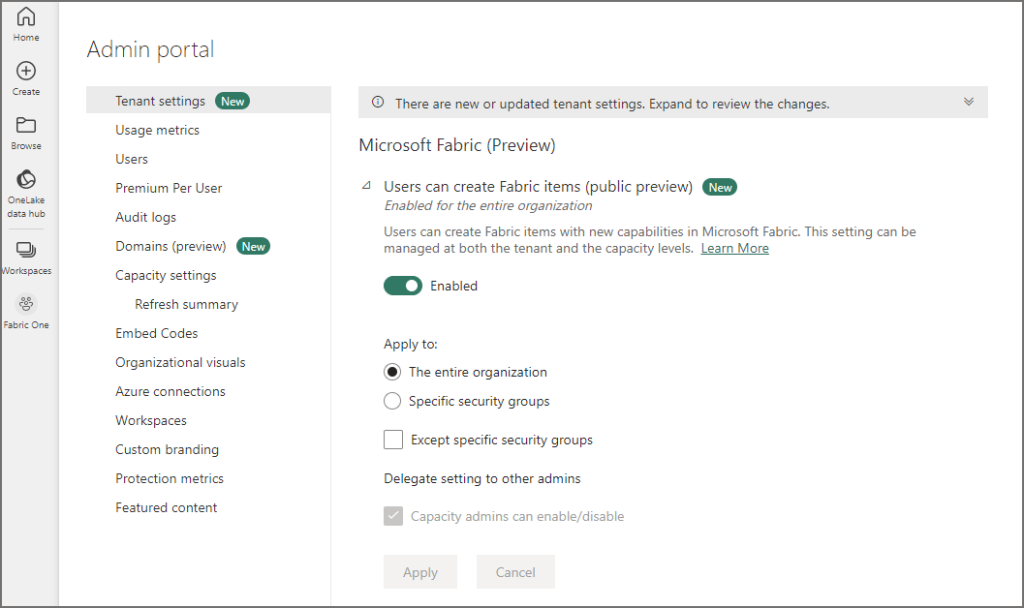
From here, select Tenant settings and you should see Microsoft Fabric at the top of the settings area. Expand the option and enable the option. I would suggest selecting Specific security groups and adding in an Active Directory group with only those users you want to have access.
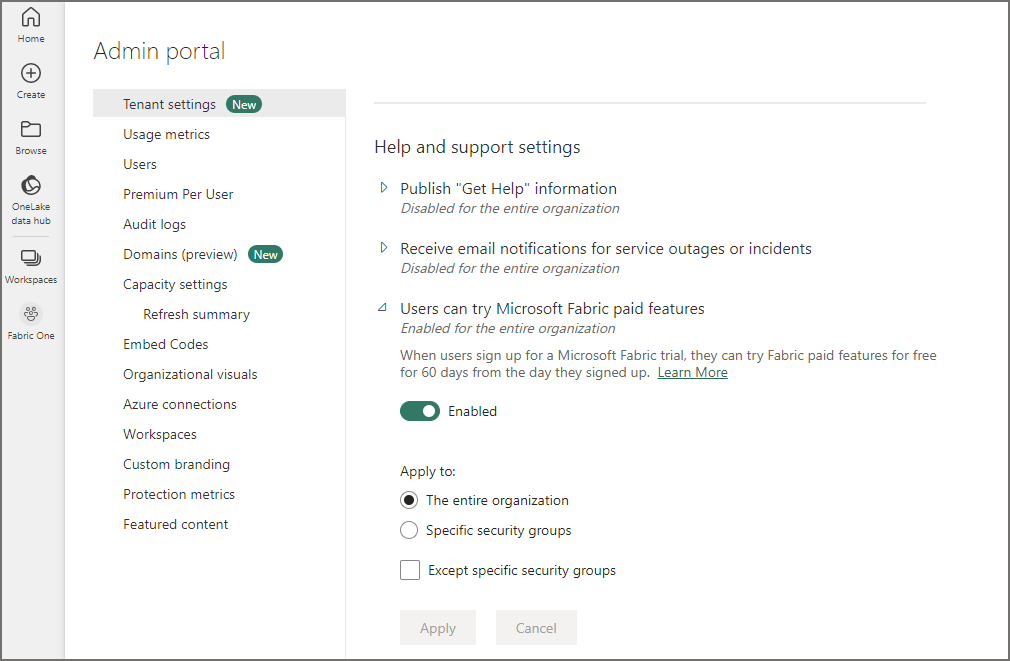
That will now enable Fabric features but you’ll need an actual capacity to run the features on. You can enable a 60 day trial by enabling it under the Help and support settings > Users can try Microsoft Fabric paid features. Again, I would suggest selecting Specific security groups and adding appropriate AD groups in with users that should have access.
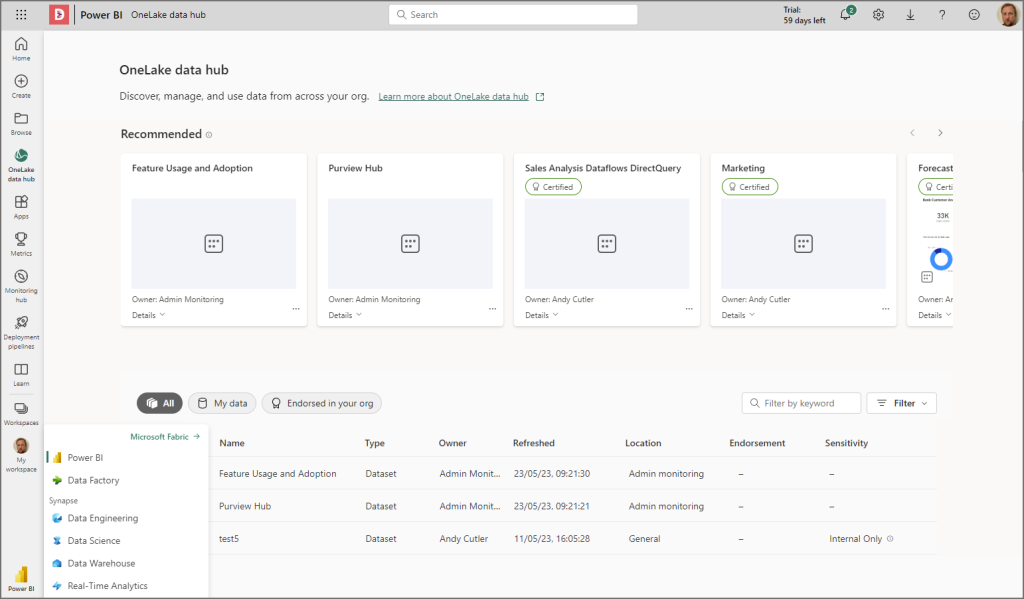
Once that’s enabled, if you go back to the home page of Power BI you should see a new icon on the left menu called Onelake Data Hub, you can click this to show a page with relevant objects. In the bottom left corner you’ll now see an icon (likely Power BI), if you click on this icon you can change to another “person”. This is the crux of working in Fabric, being able to switch between different personas for different workloads. In this example we’re going to select Data Warehouse.
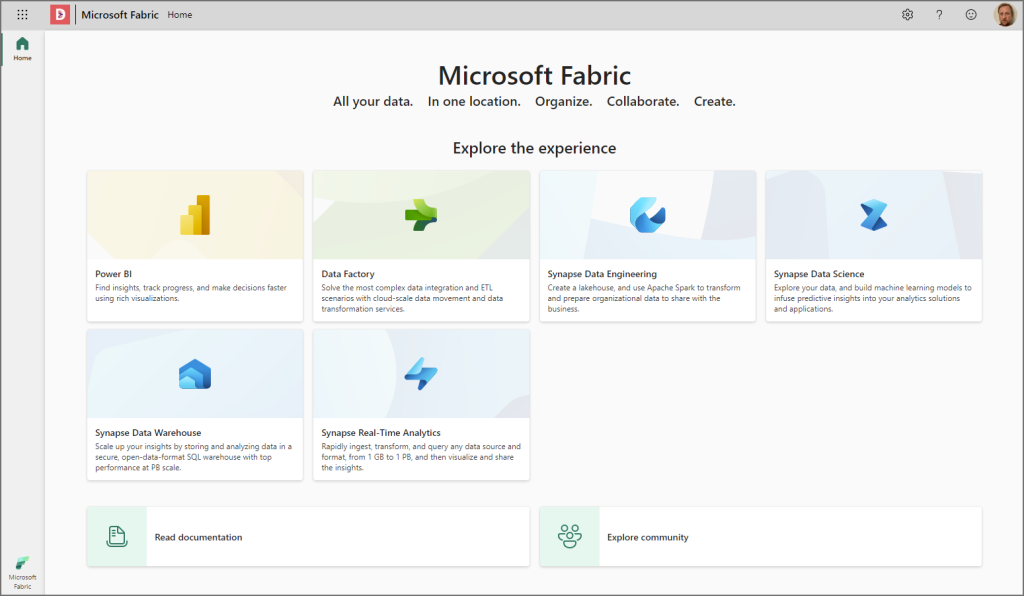
You can also access Fabric by using the URL https://app.fabric.microsoft.com/, you’ll be presented with a Microsoft Fabric splash page. In the bottom left corner you can switch between the different personas. It’s really just a redirect for app.powerbi.com.
Creating a Fabric Enabled Workspace
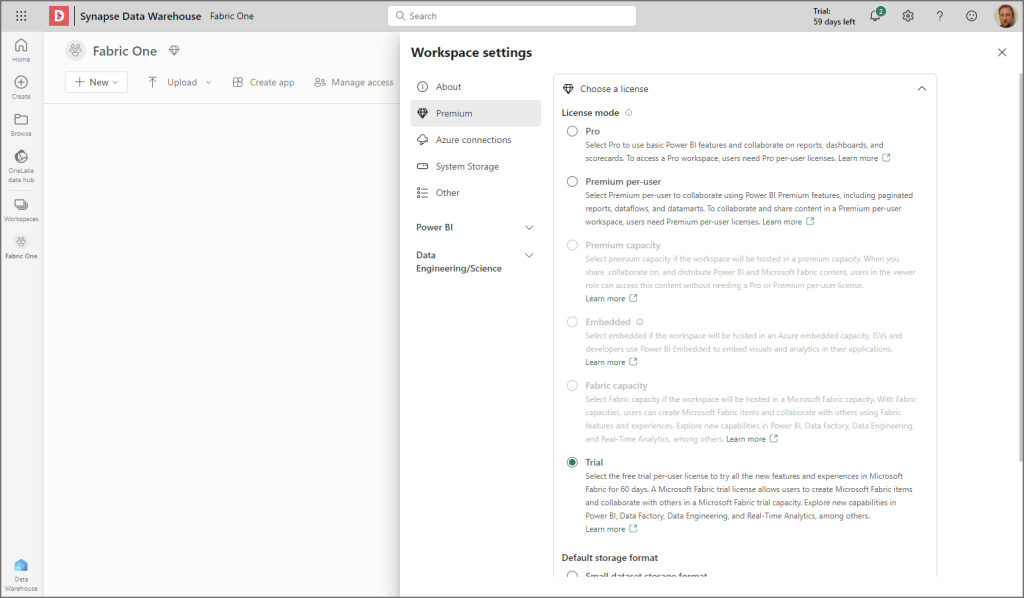
Let’s now create a new Workspace in the tenant by clicking Workspaces and then clicking + New Workspace. In the Workspace Settings we can check to make sure that the workspace is assigned to the Trial licence, which will give us access to a Fabric trial capacity for 60 days.
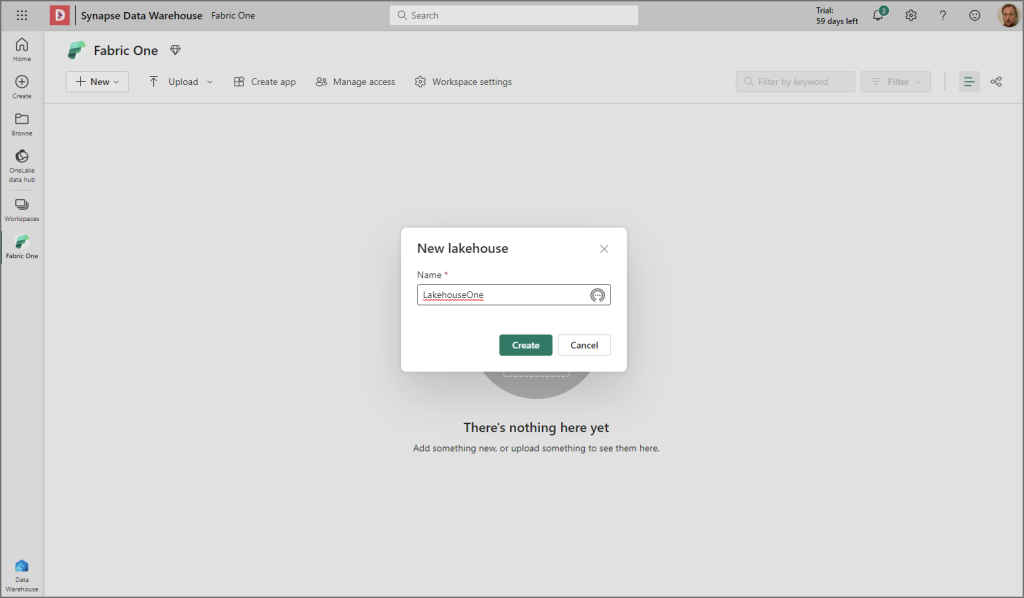
Create a New Lakehouse and Upload Data
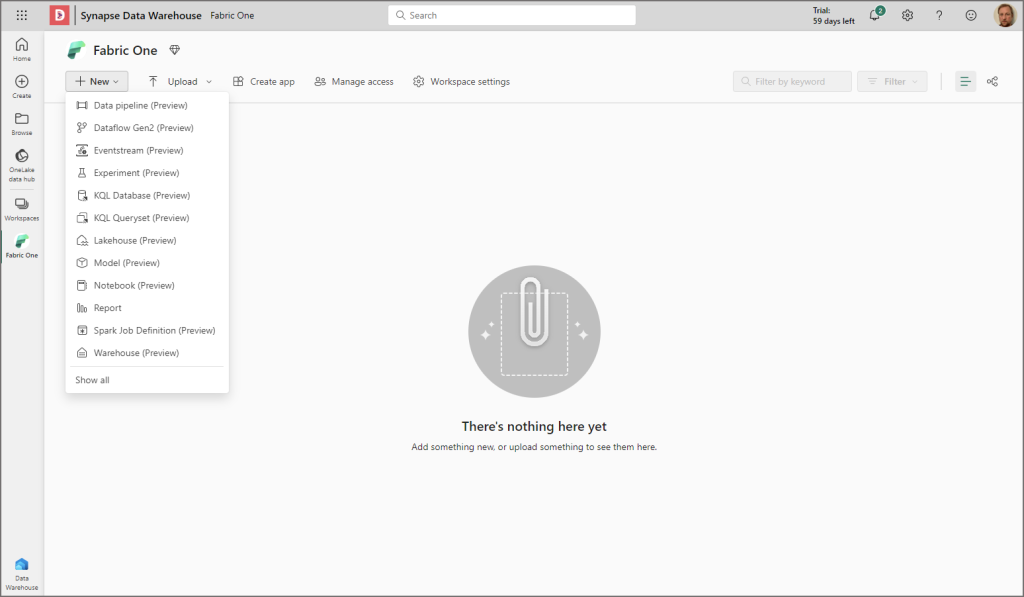
In the new workspace click New in the top left corner and select Lakehouse (preview).
Give the new Lakehouse a name and click Create.
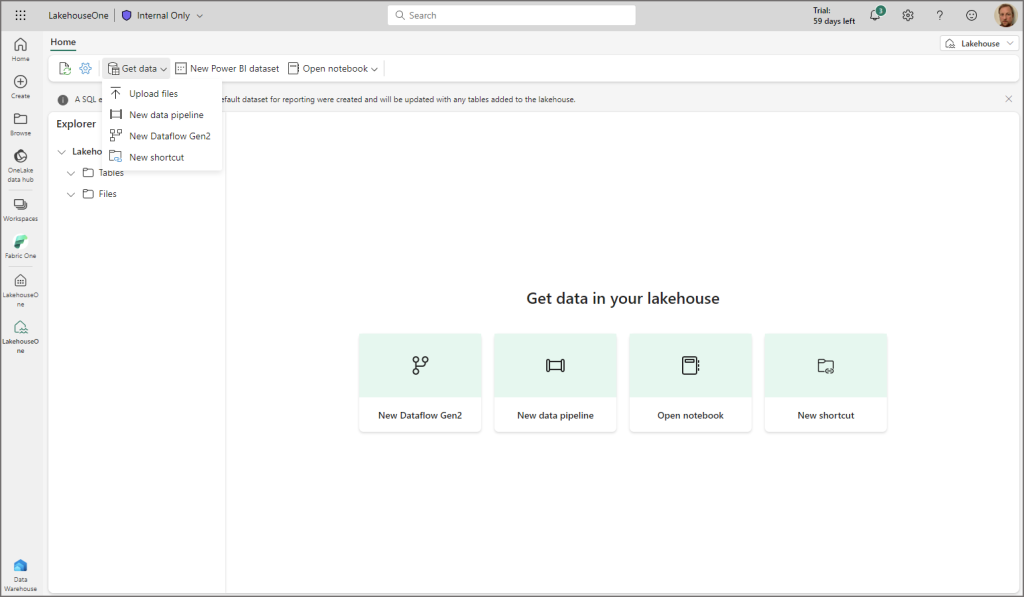
Once the new Lakehouse has been created, you’ll be in Lakehouse mode (in the top-right will be Lakehouse, we’ll be able to switch to another mode soon…). From this area you can see all files and folders that exist in Onelake, we won’t have anything in here yet as it’s a brand new Lakehouse.
What we’ll do is upload a CSV file to the Lakehouse (bear in mind we can load files into the Lakehouse using pipelines, dataflows, spark etc, but for this simple tutorial we’ll simply be uploading a file directly).
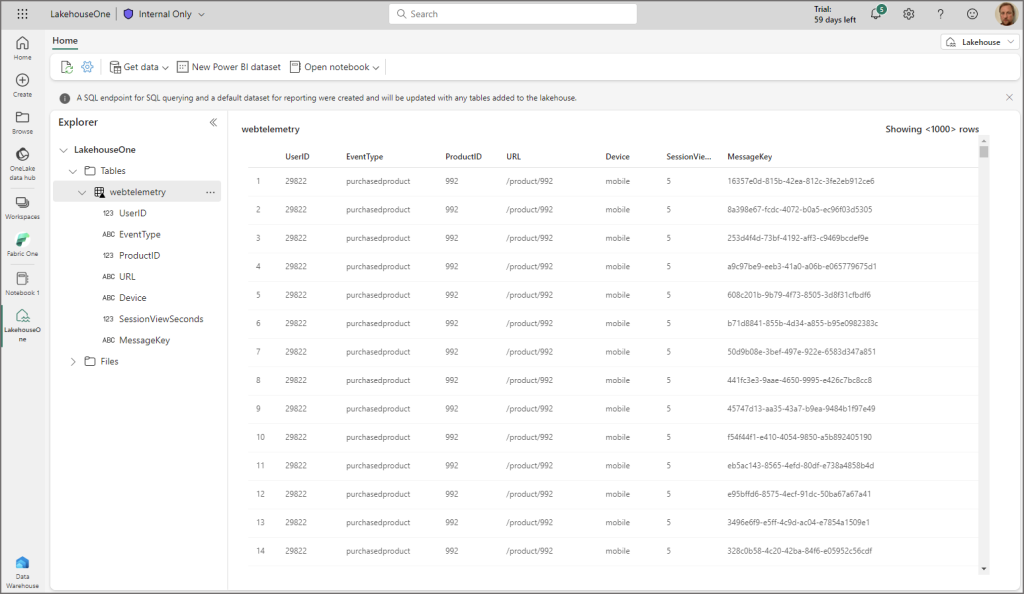
Click Get Data > Upload Files and select a file, in my case it’s a CSV file containing web telemetry data.
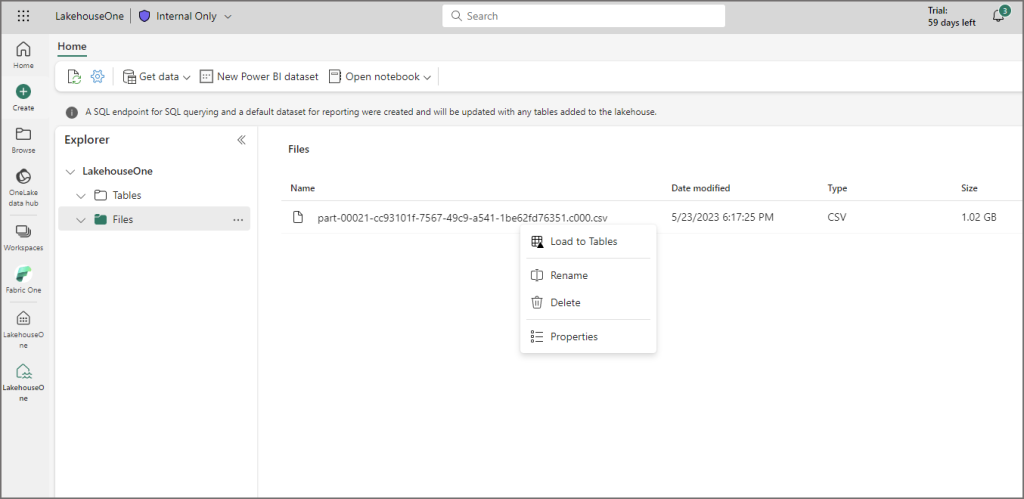
Create Delta Lake Table in Lakehouse
Now that the CSV file has been uploaded, I can convert it to a Delta table by right-clicking the file and selecting Load to Tables. Delta (underpinned by Parquet) is the storage format within the Lakehouse when working with tables.
Choose a name for the table and click Confirm.
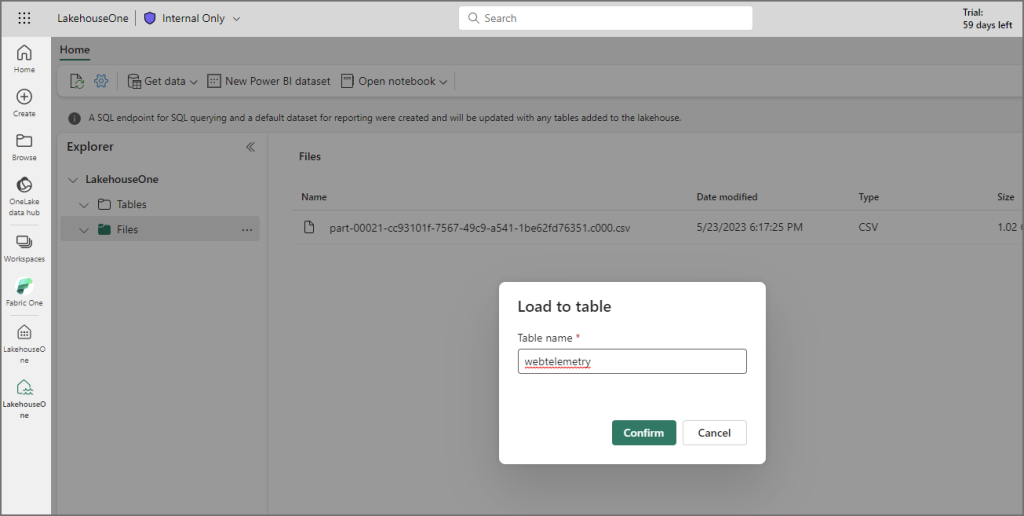
If all has been successful then you’ll see the new table name on the left hand side. If you click on the table name then a data preview should appear on the right hand side.
Query Delta Table using Spark
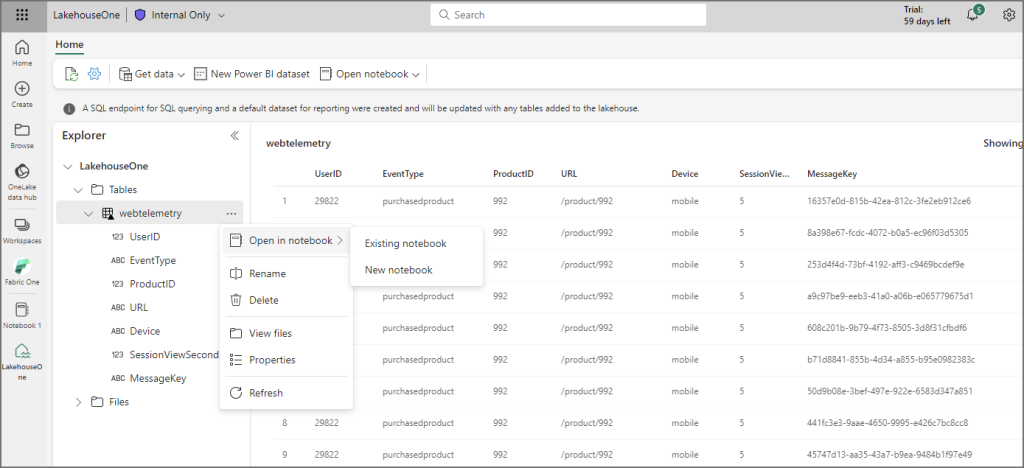
What we can now do is query the data using a Spark notebook. If you click the ellipsis on the table and select Open in notebook > New notebook then a new blank Spark notebook is created in the workspace.
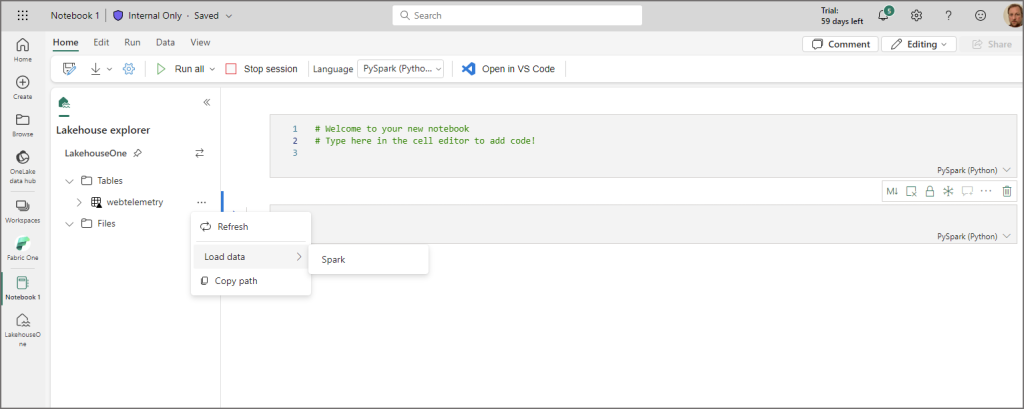
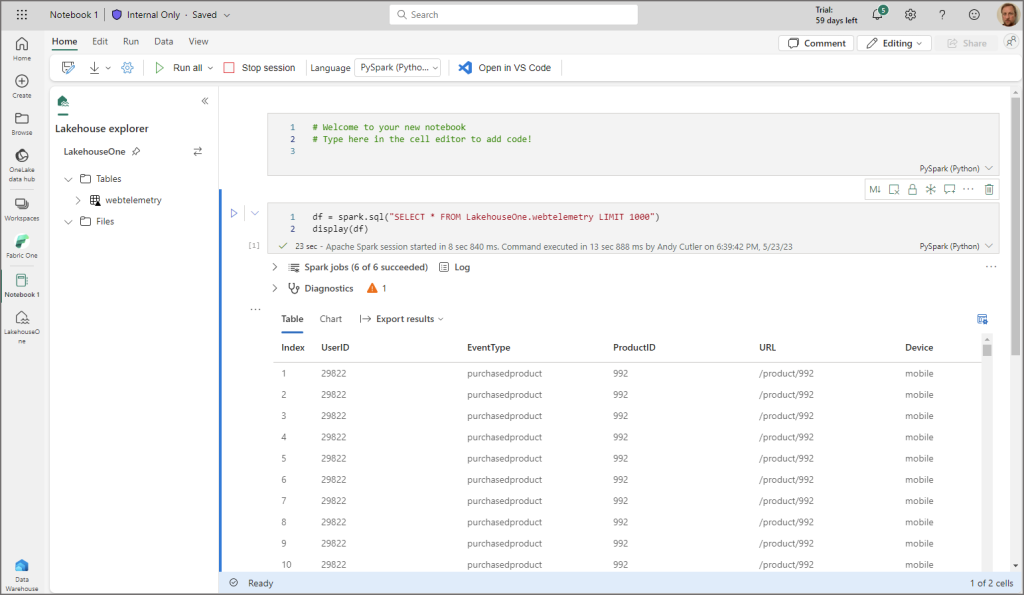
You can now click the ellipsis on the table, select Load data > Spark and auto-generated Spark code is created, run that and it’ll run a Spark session to return the table results.
By running the Spark notebook you’ll be able to see the recently loaded table results.
Using SQL Endpoint to Query and Model data
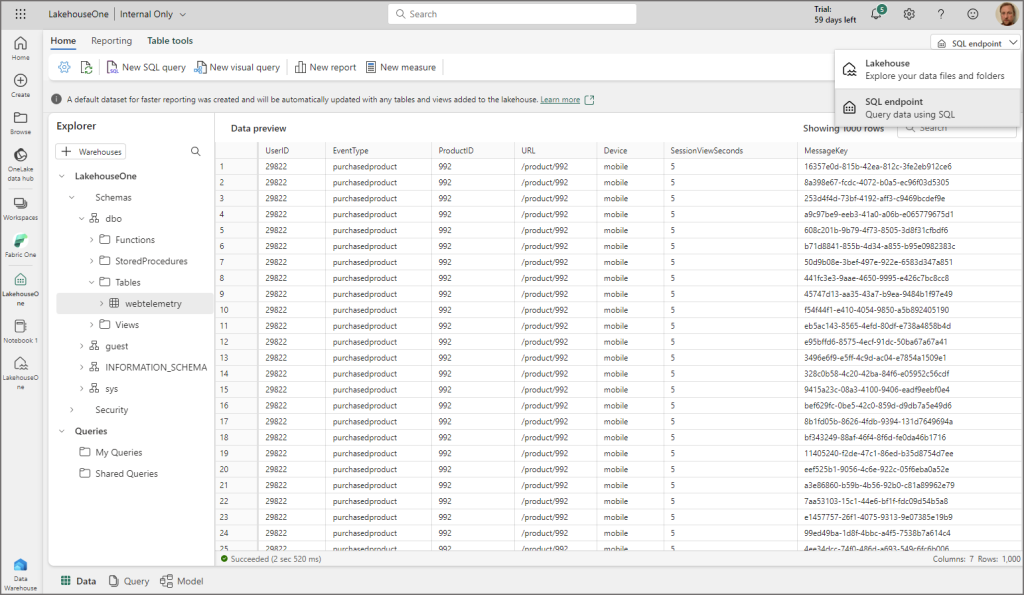
Now let’s bring the SQL endpoint into action! This is the feature that let’s us create reports using Power BI and is also accessible using external client tools like SSMS, Azure Data Studio etc. You can access the SQL endpoint by opening the workspace and clicking on the name of the SQL endpoint, this will be the name of the Lakehouse you created earlier.
Within the SQL endpoint you’ll be able to see 3 tabs at the bottom, Data, Query, and Model (yup, it’s very similar to Data Marts…). Within the Data table we can see the following objects:
- Tables
- Views
- Functions
- Stored Procedures
- Schema
btw in the top right you’ll be able to switch between the SQL endpoint and the Lakehouse mode by clicking on the dropdown menu and selecting either mode.
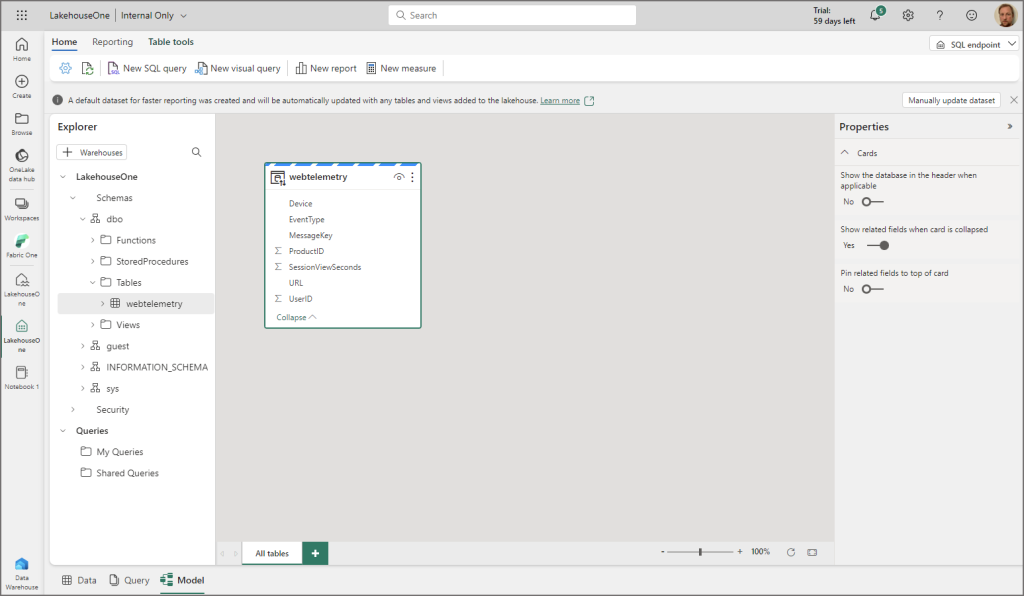
Click on the Model view to show a very familiar “Power BI” modelling experience, we can do basic modelling activities here. When the Lakehouse was created, it automatically created the SQL endpoint and also a Power BI dataset.
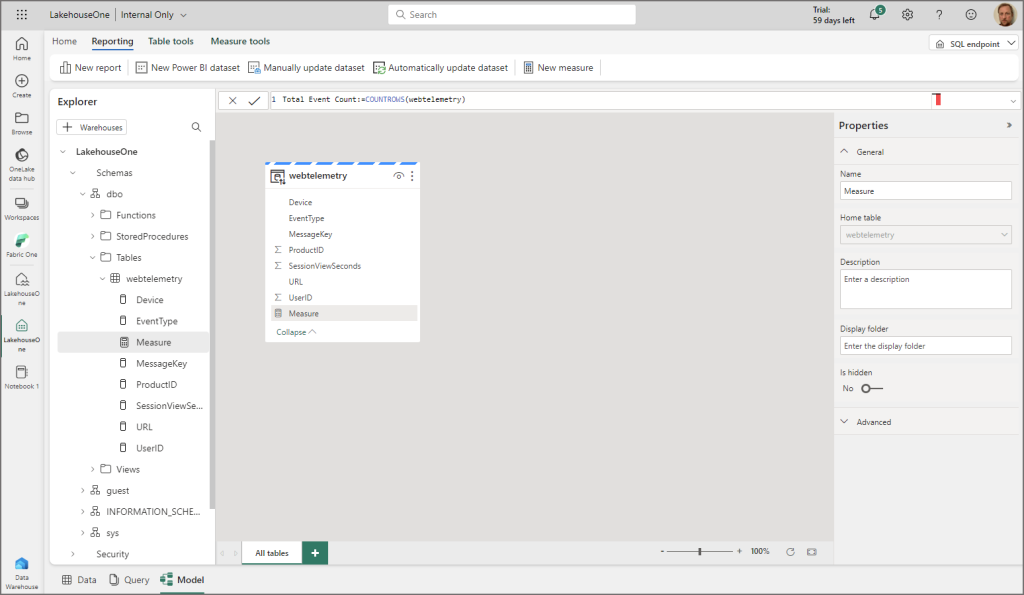
I created a measure using a COUNTROWS function and used the Advanced features in the bottom right to format the measure (thousands separator).
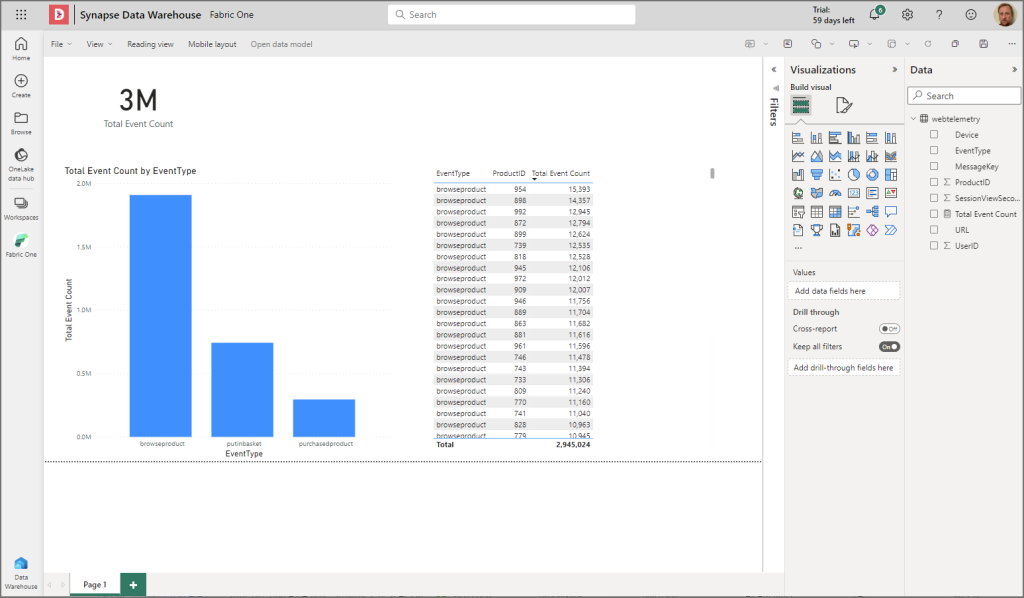
Create a Power BI Report
I then clicked New Report in the top left and the report canvas appeared which allowed me to create an (pretty basic) visualisation of the data. Now the thing about this is that there is no import mode for the Power BI dataset here, it’s querying the SQL endpoint directly using the new Direct Lake feature (import performance with directquery latency). You can also use the SQL endpoint in Import and DirectQuery mode too if creating a data model in Power BI Desktop (doesn’t support DirectLake).
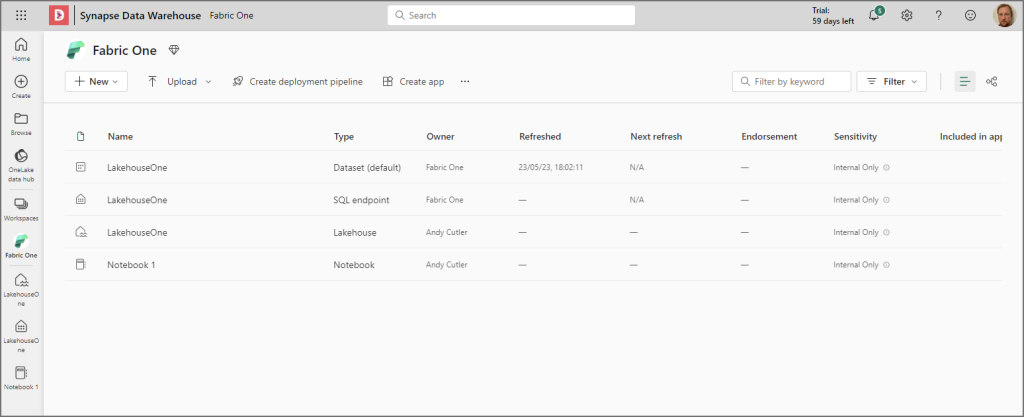
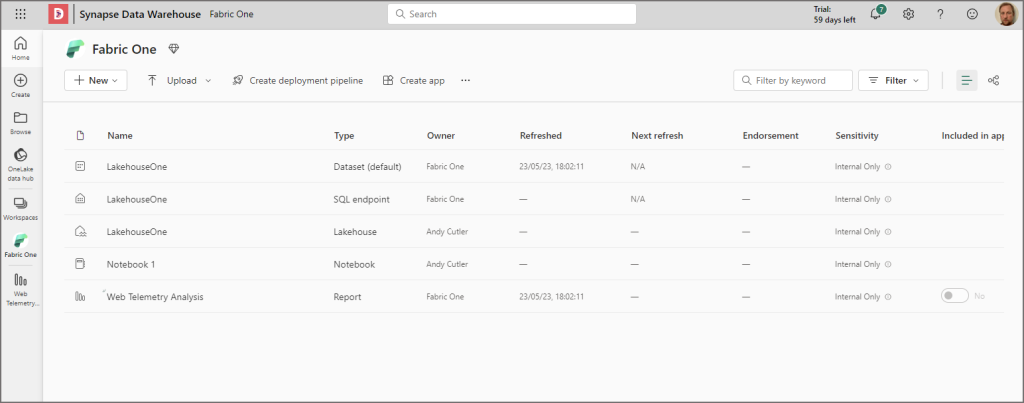
We can save the report and if we go back to the workspace, they’ll be several artifacts now. The lakehouse, the sql endpoint, the dataset, the notebook (to query the table), and the new report.
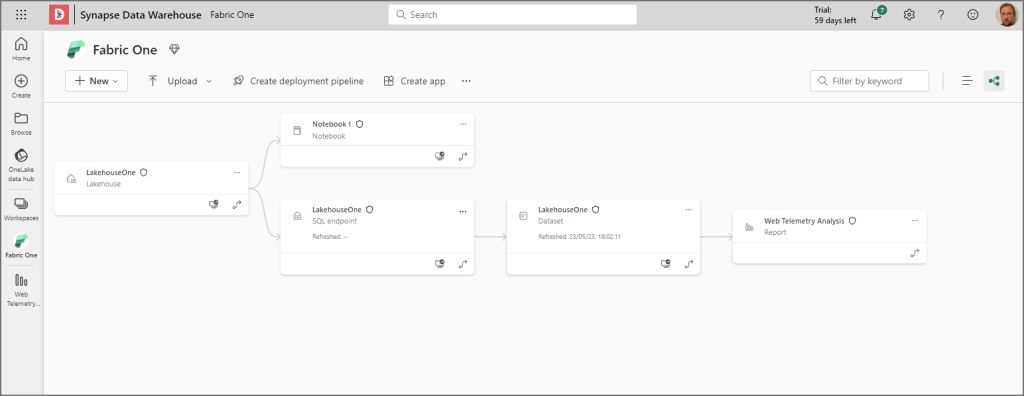
Switching to lineage view in the top right, there’s now a view of how everything is connected. From the lakehouse to the SQL endpoint to the dataset to the report.
There’s a lot more to come so dive in! I hope this very basic how-to was useful, feel free to chat here.
 Andy
Andy