

Welcome to Part 4 in the Creating a Logical Data Warehouse with Synapse Serverless SQL Pools series. We are now looking at connecting Power BI to Serverless SQL Pools to use the dimensional model we have created for reporting and analytics purposes. We can now create data visualisations in Power BI to analyse the Parquet file data stored in the Azure Data Lake storage account. We also wish to ensure that the Date dimension can filter the Fact Sales so that only the required source folders within the Azure Data Lake account are scanned and therefore reduce the data processed (minimise cost, optimise performance).
The process to read source CSV data and transform into Parquet using Serverless SQL Pools has been discussed in Parts 1, 2, and 3.
- Creating a Logical Data Warehouse with Synapse Serverless SQL: Part 1 of 4 – Setting Up and Querying Source Data

- Creating a Logical Data Warehouse with Synapse Serverless SQL: Part 2 of 4 – Creating a Dimensional Model

- Creating a Logical Data Warehouse with Synapse Serverless SQL: Part 3 of 4 – Incremental Fact Loading and Slowly Changing Dimensions

- Creating a Logical Data Warehouse with Synapse Serverless SQL: Part 4 of 4 – Connecting Power BI to the Dimensional Model

Part 4 Breakdown
The focus on this part in the series is to connect Power BI to Serverless SQL Pools but there are a few points to revisit beforehand. Here is a breakdown of what we’ll be looking at in the part.
- TLDR Summary of Blog
- Prerequisites for technical walkthrough
- Considerations
- Dimensional Model recap
- Revisiting the Fact Table
- Destination Folder Structure for Parquet Data
- Order Date Surrogate Key
- New Fact Sales View
- Connecting Power BI
- Creating Power BI Data Model using DirectQuery
- Changing the Power BI Data Model to Composite
- Conclusion
- Further Thoughts & Alternative
TLDR Summary of Blog
As this blog part has several permutations with Power BI and Serverless SQL Pools connectivity, this is a basic summary of the findings and conclusions based on the work below.
- Start by changing the Fact Sales parquet data storage so that all data is stored in a /YYYY-MM-DD/ folder structure
- Add a new column to the Fact Sales view to expose the filepath() function which is used to “partition prune” (filter on specific date folders in the Data Lake) and therefore reduce data processed
- Connect Power BI to the Dimension and Fact views in DirectQuery mode and create appropriate relationships using the surrogate keys, the Dim Date to Fact Sales join is based on the date field rather than an integer key
- Create a basic data visualisation to show Sales Order Quantity by Month Name and see Serverless SQL data processed at 218MB
- Filter only on July and see that Serverless SQL data processed remains at 218MB, which means that there is no source folder filtering, we see a JOIN in the SQL from Power BI to Serverless SQL Pools to filter the dates
- Change the Dim Date object in Power BI to Import whilst keeping Fact Sales as DirectQuery, however we still see the same behaviour
- Remove the Month Name label from the data visualisation and now we see data processed reduced to 39MB, we see IN being used in the SQL to filter the dates now
- Create a copy of the Dim Date object as Dim Date Filter and used this as the filter whilst keeping the original Dim Date as a chart axis in the data visualisation and we see data processed still at 39MB
- Conclude that if Power BI passes the date filters in using IN then Serverless SQL Pools will successfully use the filepath() filter and data processed is reduced
- Explored an alternative which involved removing the Date dimension then using the SalesOrderPathDate column in the Fact Sales view to create various date attributes, this also reduced the data processed when filtering
Prerequisites for Technical Walkthrough
To complete the Power BI exercise in this blog post, you must complete Parts 1, 2, and 3 to create the necessary Serverless SQL Pools objects and have Power BI Desktop. However, this is not required if you simply wish to follow the exercise to understand the process.
Considerations
Please note that the example Fact Sales data that we will be using is larger in size than this series available test data. This is to better illustrate the Serverless SQL Pools data processed differences in the connectivity methods we’ll use in Power BI (DirectQuery vs Composite models).
Before we jump into creating the Power BI report, let’s revisit a few points about our Serverless SQL Pools project.
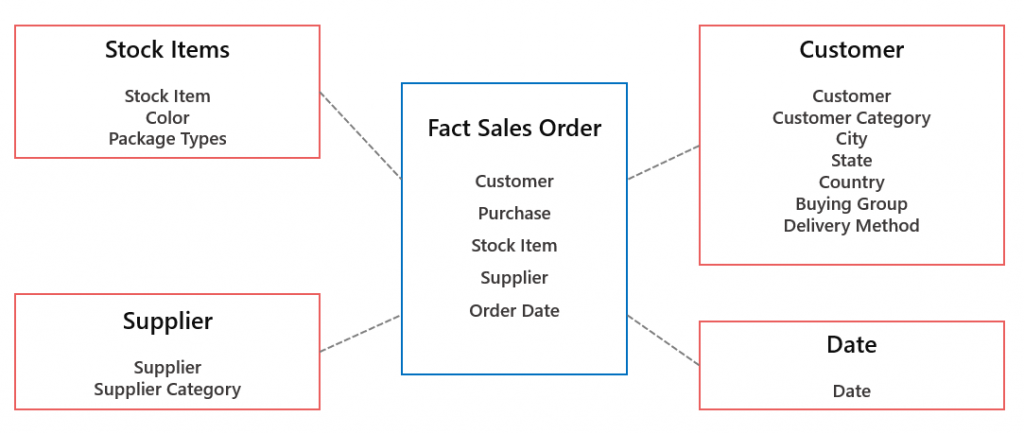
Dimensional Model
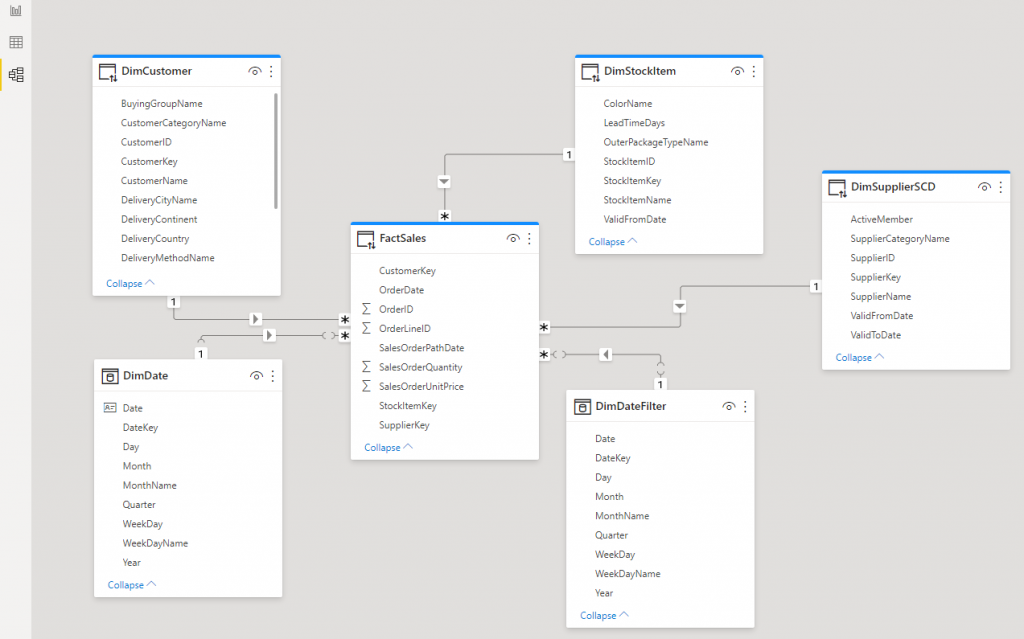
Here is the dimensional model (Star Schema) that we created from the source data model. Each of the entities is exposed as a View which we can connect to in Power BI using the Serverless SQL Pools endpoint and database.
Re-visiting the Fact Table
There are a few points we will revisit with regards to the Fact Sales data that we created.
Destination Folder Structure for Parquet Data
In Part 2 when we ran the Fact Sales data loading for the first time, we used a folder called /factsales/initial/ to store the resulting Parquet data. However, this then meant that all the source data across all dates was loaded into this folder. In Part 3 we then incrementally loaded new data into a /factsales/YYYY/MM/YYYY-MM-DD folder structure for each date. It would therefore be more sensible to load all initial and subsequent incremental Fact Sales data into the same folder structure to start with rather than use a single /initial/ folder. This can be achieved by triggering the Stored Procedure STG.LoadFactData and passing in each date that needs loading. For the benefit of Part 4, this was already been completed in the example project.
By changing the destination folder structure to /factsales/YYYY/MM/YYYY-MM-DD we can then address the next point.
Order Date Surrogate Key
In Part 2 we constructed the Fact Sales data by JOINing to the set of dimensions on the business key (source system ID column E.G. SupplierId) to obtain the Surrogate Key (E.G. SupplierKey). However, for the OrderDateKey we used the SQL FORMAT function to transform the Sales Order Date into an Integer key. E.G. 2021-04-16 became 20210416. Although this allows us to join the Fact Sales and Dim Date tables together using this key and filter on specific dates or a date range, we do not have the benefit of partition pruning (filter source folders in the Data Lake) when using this key. Let’s look at why…
Serverless SQL Pools provides a SQL function called filepath() which can be used to filter source folders in the Data Lake, this is useful to reduce the amount of data processed (and therefore cost) and also for performance when selecting data. We will now add this function into the LDW.vwFactSales view as a new column called SalesOrderPathDate and specify the /YYYY-MM-DD/ folder level from the Data Lake structure (the third * wildcard in the BULK parameter). We will then be able to use this new column to filter on specific dates and Serverless SQL Pools will only scan the contents of folders that match the filter.
We will use this new column SalesOrderPathDate as the relationship between the Fact Sales and Dim Date in the Power BI model.
New Fact Sales View
DROP VIEW LDW.vwFactSales;
GO

CREATE VIEW LDW.vwFactSales
AS
SELECT *,
CAST(fct.filepath(3) AS DATE) AS SalesOrderPathDate
 FROM
OPENROWSET
(
    BULK 'conformed/facts/factsales/*/*/*/*.parquet',
    DATA_SOURCE = 'ExternalDataSourceDataLake',
    FORMAT = 'Parquet'
) AS fct
We can now use the SalesOrderPathDate column to filter on specific source system folders:
SELECT COUNT(OrderLineID)
FROM LDW.vwFactSales
WHERE SalesOrderPathDate = '2020-07-15'

SELECT SalesOrderPathDate,
        COUNT(OrderLineID)
FROM LDW.vwFactSales
WHERE MONTH(SalesOrderPathDate) = 7 AND YEAR(SalesOrderPathDate) = 2020
GROUP BY SalesOrderPathDate
ORDER BY SalesOrderPathDate
Although we can now query using this column, how will the changes made to the View impact how we connect the Dim Date and Fact Sales together in Power BI? This is one of the points raised in the next section in this blog.
Connecting Power BI
We will now connect to Serverless SQL Pools using Power BI Desktop, select the Dimension and Fact Views that were created in Part 2, define relationships between these Views within Power BI, and finally build and test a report with Date filters.
Creating Power BI Data Model using DirectQuery
We’ll now walkthrough the process of connecting Power BI to Serverless SQL Pools. There will be minimal Power BI object formatting as the overall objective of this blog post is to get Power BI connected to Serverless SQL Pools.
Connect to Serverless SQL Pools
- Open Power BI Desktop and click Get Data
- Search for azure synapse analytics then select Azure Synapse Analytics (SQL DW) from the results.
- Click Connect
- Specify the Server value which will be the Serverless SQL endpoint visible in the Azure portal for the Synapse workspace. E.G. synapsedemo-ondemand.sql.azuresynapse.net
- Specify the Database value, which for this series is called sqllogicaldw
- Ensure DirectQuery is selected under Data Connectivity mode
- Click OK
Select Dimension and Fact Views
- In the Navigator window which shows the list of Views within the sqllogicaldw database, click the checkbox (therefore selecting) the following:
- LDW.vwDimCustomer
- LDW.vwDimDate
- LDW.vwDimStockItem
- LDW.vwDimSupplierSCD (or LDW.vwDimSupplier if you have not completed Part 3 in this series)
- LDW.vwFactSales
- Click Transform Data and ensure the data types for the following columns are showing as Date.
- LDW vwFactSales.SalesOrderDatePath
- LDW vwDimDate.Date
- Remove the LDW vw prefix from each View name
- On the Power Query Editor window, click Close & Apply
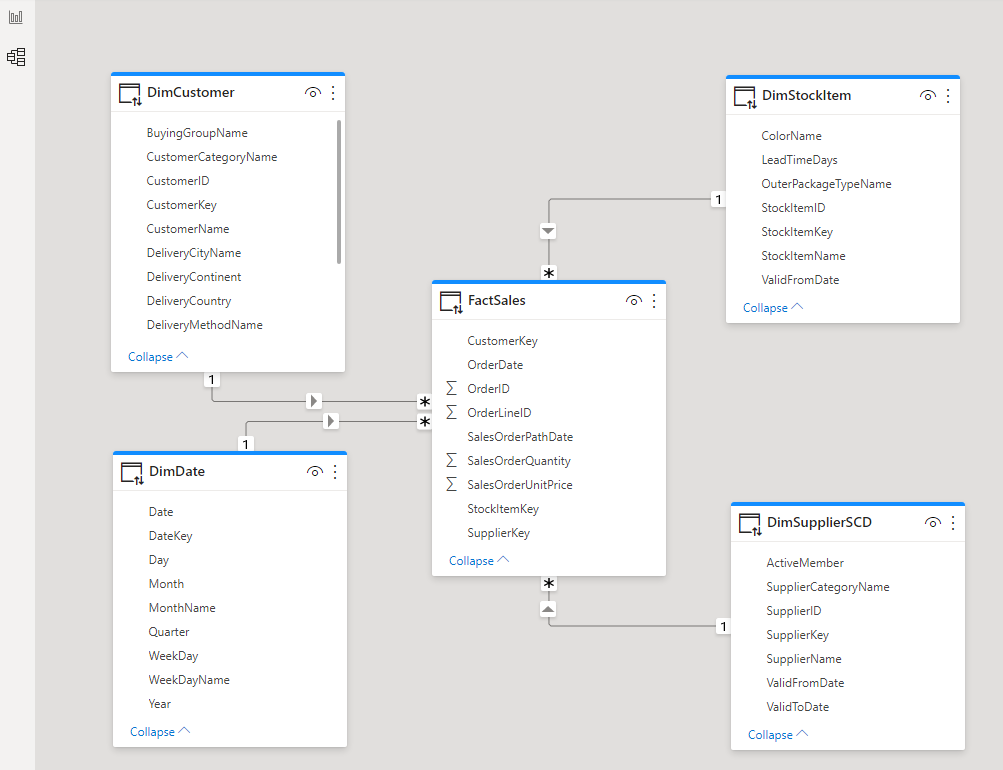
Define Relationships Between Views
- Click the Model icon on the right hand side.
- Create relationships between the following columns:
- DimCustomer.CustomerKey > Fact Sales.CustomerKey
- DimDate.Date > Fact Sales.SalesOrderPathDate
- DimStockItem.StockItemKey > Fact Sales.StockItemKey
- DimSupplierSCD.SupplierKey > Fact Sales.SupplierKey
- The model should now look like this:
Create Report and Test Date Filters
- Click File > Options & Settings > Options then under Current File > Query Reduction > Filters select Add a single Apply button to the filter pane to apply changes at once then click OK
- Click on the Report icon to switch the view to the canvas
- Select the DimDate.MonthName column and in the Column tools menu at the top, select Sort By Column > Month (this will sort the names of the Month by the Month number to get the correct order)
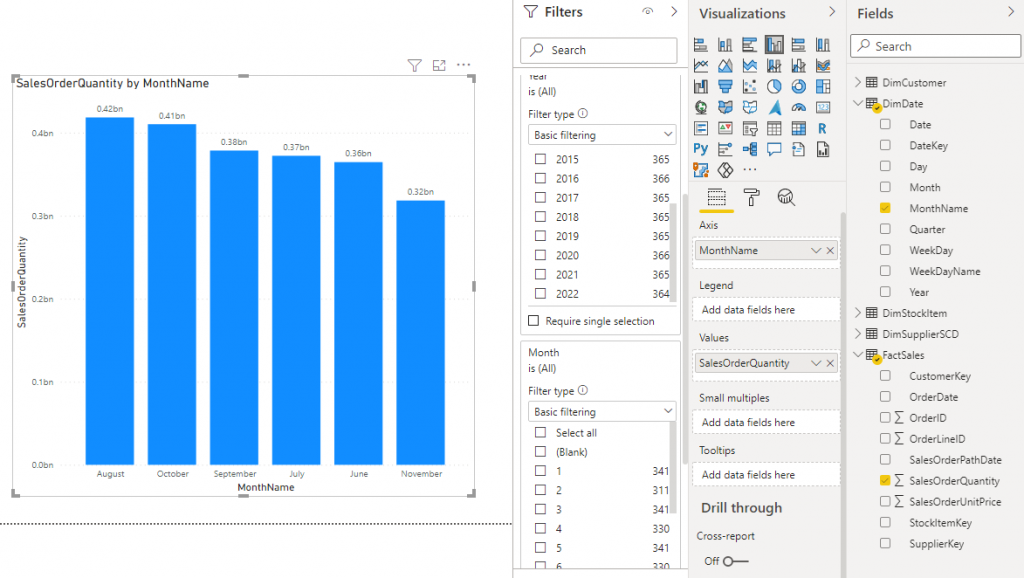
- Drag the FactSales.SalesOrderQuantity column onto the canvas to create simple column chart visualisation, this will now trigger a query on the Serverless SQL Pool to return the SUM of this column.
- Drag the DimDate.MonthName column onto the column chart to add the Month name as the axis
- Expand the Filters pane on the right and drag the DimDate.Year and DimDate.Month columns into the filters and change the filter type to Basic filtering
- The report should now look like this:
Check SQL Syntax from Power BI
Let’s check the SQL that has been run on the Serverless SQL Pools database. We do this in Synapse Studio by clicking Monitor > SQL Requests
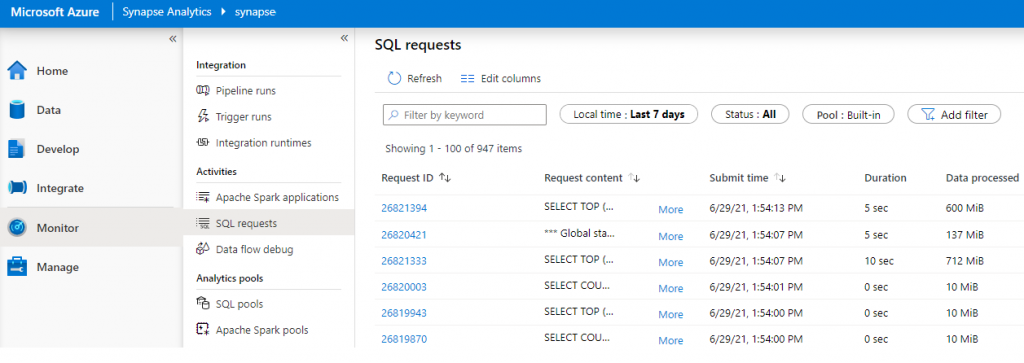
We can see each SQL request sent to the Serverless SQL Pool and the Data Processed metric for each request. By clicking More on the relevant request we can see the SQL statement. The SQL request for the report above is as follows:
--code generate by Power BI and sent to Serverless SQL Pool

SELECT
TOP (1000001) [t1].[Month],[t1].[MonthName],SUM(
CAST([t4].[SalesOrderQuantity] as BIGINT)
)
 AS [a0]
FROM
((
select [$Table].[CustomerKey] as [CustomerKey],
    [$Table].[OrderDate] as [OrderDate],
    [$Table].[StockItemKey] as [StockItemKey],
    [$Table].[SupplierKey] as [SupplierKey],
    [$Table].[OrderID] as [OrderID],
    [$Table].[OrderLineID] as [OrderLineID],
    [$Table].[SalesOrderQuantity] as [SalesOrderQuantity],
    [$Table].[SalesOrderUnitPrice] as [SalesOrderUnitPrice],
    [$Table].[SalesOrderPathDate] as [SalesOrderPathDate]
from [LDW].[vwFactSales] as [$Table]
) AS [t4]
 LEFT OUTER JOIN
(
select [$Table].[DateKey] as [DateKey],
    [$Table].[Date] as [Date],
    [$Table].[Day] as [Day],
    [$Table].[WeekDay] as [WeekDay],
    [$Table].[WeekDayName] as [WeekDayName],
    [$Table].[Month] as [Month],
    [$Table].[MonthName] as [MonthName],
    [$Table].[Quarter] as [Quarter],
    [$Table].[Year] as [Year]
from [LDW].[vwDimDate] as [$Table]
) AS [t1] on
(
[t4].[SalesOrderPathDate] = [t1].[Date]
)
)
GROUP BY [t1].[Month],[t1].[MonthName]
The amount of data processed shows as 218MB:

If we now use the Year and Month filters to specify a particular month, in this case we’ll select 2020 and 7. This is the SQL that is sent from Power BI, as you can see there is a JOIN between the Fact Sales and the Dim Date views then a WHERE filter on the Dim Date view.
--code generate by Power BI and sent to Serverless SQL Pool
SELECT
TOP (1000001) [t1].[MonthName],SUM(
CAST([t4].[SalesOrderQuantity] as BIGINT)
)
 AS [a0]
FROM
((
select [$Table].[CustomerKey] as [CustomerKey],
    [$Table].[OrderDate] as [OrderDate],
    [$Table].[StockItemKey] as [StockItemKey],
    [$Table].[SupplierKey] as [SupplierKey],
    [$Table].[OrderID] as [OrderID],
    [$Table].[OrderLineID] as [OrderLineID],
    [$Table].[SalesOrderQuantity] as [SalesOrderQuantity],
    [$Table].[SalesOrderUnitPrice] as [SalesOrderUnitPrice],
    [$Table].[SalesOrderPathDate] as [SalesOrderPathDate]
from [LDW].[vwFactSales] as [$Table]
) AS [t4]
 LEFT OUTER JOIN
(
select [$Table].[DateKey] as [DateKey],
    [$Table].[Date] as [Date],
    [$Table].[Day] as [Day],
    [$Table].[WeekDay] as [WeekDay],
    [$Table].[WeekDayName] as [WeekDayName],
    [$Table].[Month] as [Month],
    [$Table].[MonthName] as [MonthName],
    [$Table].[Quarter] as [Quarter],
    [$Table].[Year] as [Year]
from [LDW].[vwDimDate] as [$Table]
) AS [t1] on
(
[t4].[SalesOrderPathDate] = [t1].[Date]
)
)
WHERE
(
(
[t1].[Month] = 7
)
 AND
(
[t1].[Year] = 2020
)
)
GROUP BY [t1].[MonthName]
However, the data processed amount still shows as 218MB which means that the same amount of data across the Data Lake folders was scanned even though we requested data from a specific month.

As at time of writing this blog it would seem that by JOINing to the column in the Fact view that uses the filepath() function, it does not isolate and scan only the dates that support the query. In this case we would expect only the folders in the /factsales/2020/7/ folder to be scanned as the Dates in the Dim Date view would be the range of 2020-07-01 to 2020-07-31.
Changing the Power BI Data Model to Composite
If we set the Dim Date table to Import mode whilst keeping the Fact Sales table as DirectQuery, then the SQL query passed to Serverless SQL Pools will still use JOIN and although we see only July data in the data visualisation, there has not been a successful filtering only on the required source folders as data processed remains at 218MB.
However, if we then remove the Month Name from the data visualisation, we now see IN being used to filter dates which will successfully filter only on the required source folders and we see data processed reduced to 39MB.
SELECT SUM(
CAST([t4].[SalesOrderQuantity] as BIGINT)
)
 AS [a0]
FROM
(
(
select [$Table].[CustomerKey] as [CustomerKey],
    [$Table].[OrderDate] as [OrderDate],
    [$Table].[StockItemKey] as [StockItemKey],
    [$Table].[SupplierKey] as [SupplierKey],
    [$Table].[OrderID] as [OrderID],
    [$Table].[OrderLineID] as [OrderLineID],
    [$Table].[SalesOrderQuantity] as [SalesOrderQuantity],
    [$Table].[SalesOrderUnitPrice] as [SalesOrderUnitPrice],
    [$Table].[SalesOrderPathDate] as [SalesOrderPathDate]
from [LDW].[vwFactSales] as [$Table]
)
)
 AS [t4]
WHERE
(
([t4].[SalesOrderPathDate] IN (CAST( '20200612 00:00:00' AS datetime),CAST( '20200626 00:00:00' AS datetime),CAST( '20200613 00:00:00' AS datetime),CAST( '20200627 00:00:00' AS datetime),CAST( '20200614 00:00:00' AS datetime),CAST( '20200601 00:00:00' AS datetime),CAST( '20200615 00:00:00' AS datetime),CAST( '20200628 00:00:00' AS datetime),CAST( '20200602 00:00:00' AS datetime),CAST( '20200629 00:00:00' AS datetime),CAST( '20200603 00:00:00' AS datetime),CAST( '20200616 00:00:00' AS datetime),CAST( '20200630 00:00:00' AS datetime),CAST( '20200617 00:00:00' AS datetime),CAST( '20200604 00:00:00' AS datetime),CAST( '20200618 00:00:00' AS datetime),CAST( '20200605 00:00:00' AS datetime),CAST( '20200619 00:00:00' AS datetime),CAST( '20200606 00:00:00' AS datetime),CAST( '20200620 00:00:00' AS datetime),CAST( '20200607 00:00:00' AS datetime),CAST( '20200621 00:00:00' AS datetime),CAST( '20200608 00:00:00' AS datetime),CAST( '20200609 00:00:00' AS datetime),CAST( '20200622 00:00:00' AS datetime),CAST( '20200623 00:00:00' AS datetime),CAST( '20200610 00:00:00' AS datetime),CAST( '20200624 00:00:00' AS datetime),CAST( '20200611 00:00:00' AS datetime),CAST( '20200625 00:00:00' AS datetime)))
)
In the steps below we’ll set Dim Date to Import mode and then create another Dim Date and rename to Dim Date Filter. We’ll use the original Dim Date in the data visualisation as an axis and use the new Dim Date Filter just as a filter.
Set Dim Date to Import Mode and create new Date Filter
In the Power BI report:
- Click the Model icon to show the model diagram view
- Select the Dim Date object and in Properties > Advanced change the Storage Mode to Import
- Click Transform Data in the top menu then Transform Data
- In the Power Query editor, right-click DimDate and select Reference
- Rename this to DimDateFilter
- Click Close & Apply > Close & Apply
- Open the Model view and create a relationship between the Fact Sales.SalesOrderDatePath and DimDateFilter.Date columns
- Our model now looks like the following:
If we now change the Year and Month filters to use DimDateFilter and use Month Name from DimDate then we see IN being used in the SQL and data processed at 39MB which means successful source folder filtering.
SELECT
TOP (1000001) [semijoin1].[c21],[semijoin1].[c22],SUM(
CAST([a0] as BIGINT)
)
 AS [a0]
FROM
(
(

SELECT [t4].[SalesOrderPathDate] AS [c50],[t4].[SalesOrderQuantity] AS [a0]
FROM
(
(
select [$Table].[CustomerKey] as [CustomerKey],
    [$Table].[OrderDate] as [OrderDate],
    [$Table].[StockItemKey] as [StockItemKey],
    [$Table].[SupplierKey] as [SupplierKey],
    [$Table].[OrderID] as [OrderID],
    [$Table].[OrderLineID] as [OrderLineID],
    [$Table].[SalesOrderQuantity] as [SalesOrderQuantity],
    [$Table].[SalesOrderUnitPrice] as [SalesOrderUnitPrice],
    [$Table].[SalesOrderPathDate] as [SalesOrderPathDate]
from [LDW].[vwFactSales] as [$Table]
)
)
 AS [t4]
WHERE
(
([t4].[SalesOrderPathDate] IN (CAST( '20200710 00:00:00' AS datetime),CAST( '20200724 00:00:00' AS datetime),CAST( '20200711 00:00:00' AS datetime),CAST( '20200725 00:00:00' AS datetime),CAST( '20200712 00:00:00' AS datetime),CAST( '20200713 00:00:00' AS datetime),CAST( '20200726 00:00:00' AS datetime),CAST( '20200714 00:00:00' AS datetime),CAST( '20200727 00:00:00' AS datetime),CAST( '20200701 00:00:00' AS datetime),CAST( '20200728 00:00:00' AS datetime),CAST( '20200702 00:00:00' AS datetime),CAST( '20200715 00:00:00' AS datetime),CAST( '20200729 00:00:00' AS datetime),CAST( '20200716 00:00:00' AS datetime),CAST( '20200730 00:00:00' AS datetime),CAST( '20200703 00:00:00' AS datetime),CAST( '20200717 00:00:00' AS datetime),CAST( '20200731 00:00:00' AS datetime),CAST( '20200704 00:00:00' AS datetime),CAST( '20200718 00:00:00' AS datetime),CAST( '20200705 00:00:00' AS datetime),CAST( '20200719 00:00:00' AS datetime),CAST( '20200706 00:00:00' AS datetime),CAST( '20200720 00:00:00' AS datetime),CAST( '20200707 00:00:00' AS datetime),CAST( '20200708 00:00:00' AS datetime),CAST( '20200721 00:00:00' AS datetime),CAST( '20200722 00:00:00' AS datetime),CAST( '20200709 00:00:00' AS datetime),CAST( '20200723 00:00:00' AS datetime)))
)
)
 AS [basetable0]
 INNER JOIN
(
(SELECT 9 AS [c22],9 AS [c21],CAST( '20120701 00:00:00' AS datetime) AS [c50] )  UNION ALL
....
--a derived list of dates to be used in the data visualisation
Conclusion
As we have seen, there are caveats when connecting Power BI to Serverless SQL Pools where we wish to use a Date dimension to filter the data and ensure that only the source folders in the Data Lake that are needed are indeed scanned. This is vital when looking to reduce data processed as not only does reducing the amount of data processed reduce the cost, it also improved performance. Power BI supports connecting to the Views within Serverless SQL Pools as either Import or DirectQuery, it’s important to note that we wish to keep the data in the source data lake and minimise importing. However, as the Date dimension is a fixed dataset we can import this data and use this to filter the DirectQuery Fact Sales. We have seen that if we wish Power BI to pass IN to Serverless SQL Pools, we can only use the Date dimension as a filter, we must therefore create another Dim Date to use in the data visualisation.
Further Thoughts & Alternative
As we have seen, if we expose the filepath() function in a View to return the YYYY-MM-DD value, we can then use this to filter the source folders and reduce data processed. However, to invoke this from Power BI we need to set the Date dimension as Import and only use this as a filter. This will send the list of dates as an IN filter. However, for large date ranges this will create a big SQL statement. We could therefore expose the Year and Month levels from the source folder structure and use these as a filter.
Remove Date Dimension and Create Simple Date Fields
We have an alternative to using a separate Date dimension and that is to use Power BI’s transformation features to create various Date attributes from the SalesOrderPathDate column in Fact Sales. The image below shows 4 columns that have been created by duplicating the SalesOrderPathDate column (right-click > Duplicate Column) and then applying a Date transform. E.G. for Month, the following was set: Transform > Month > Month.
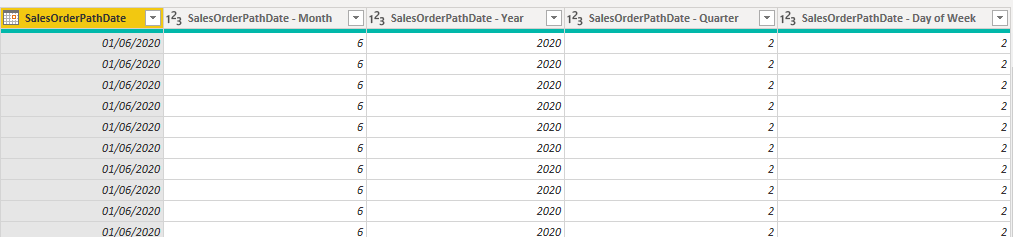
Please note that transforms which return the name of the month or name of the day will break query folding and Power BI will not be able to push the entire SQL statement down to Serverless SQL Pools.
The SQL passed to Serverless SQL Pools is as follows when using these columns as filters:
SELECT

TOP (1000001) [t0].[SalesOrderPathDate - Year],SUM(
CAST([t0].[SalesOrderQuantity] as BIGINT)
)
 AS [a0]
FROM
(
(
select [_].[CustomerKey] as [CustomerKey],
    [_].[OrderDate] as [OrderDate],
    [_].[StockItemKey] as [StockItemKey],
    [_].[SupplierKey] as [SupplierKey],
    [_].[OrderID] as [OrderID],
    [_].[OrderLineID] as [OrderLineID],
    [_].[SalesOrderQuantity] as [SalesOrderQuantity],
    [_].[SalesOrderUnitPrice] as [SalesOrderUnitPrice],
    [_].[SalesOrderPathDate] as [SalesOrderPathDate],
    datepart("m", [_].[SalesOrderPathDate - Copy]) as [SalesOrderPathDate - Month],
    datepart("yyyy", [_].[SalesOrderPathDate - Copy2]) as [SalesOrderPathDate - Year],
    datepart("qq", [_].[SalesOrderPathDate - Copy3]) as [SalesOrderPathDate - Quarter],
    datepart("dw", [_].[SalesOrderPathDate - Copy4]) as [SalesOrderPathDate - Day of Week]
from
(
    select [_].[CustomerKey] as [CustomerKey],
        [_].[OrderDate] as [OrderDate],
        [_].[StockItemKey] as [StockItemKey],
        [_].[SupplierKey] as [SupplierKey],
        [_].[OrderID] as [OrderID],
        [_].[OrderLineID] as [OrderLineID],
        [_].[SalesOrderQuantity] as [SalesOrderQuantity],
        [_].[SalesOrderUnitPrice] as [SalesOrderUnitPrice],
        [_].[SalesOrderPathDate] as [SalesOrderPathDate],
        [_].[SalesOrderPathDate] as [SalesOrderPathDate - Copy],
        [_].[SalesOrderPathDate] as [SalesOrderPathDate - Copy2],
        [_].[SalesOrderPathDate] as [SalesOrderPathDate - Copy3],
        [_].[SalesOrderPathDate] as [SalesOrderPathDate - Copy4]
    from [LDW].[vwFactSales] as [_]
) as [_]
)
)
 AS [t0]
WHERE
(
[t0].[SalesOrderPathDate - Month] = 9
)
GROUP BY [t0].[SalesOrderPathDate - Year] Andy
Andy