

I’m currently in the process of building a Query and Workload Analyser Power BI report which queries several DMVs (Dynamic Management Views) in Synapse Dedicated SQL Pools. One of the relevant DMVs included in the report is sys.dm_pdw_exec_sessions (link here) which holds a row for every session initiated on the Dedicated SQL Pools. This DMV can then be linked to another DMV such as sys.dm_pdw_exec_requests to join together relevant data for analysing sessions and SQL queries being run.
sys.dm_pdw_exec_sessions
The sys.dm_pdw_exec_sessions DMV holds information such as the user login and login time, the status of the session, session ID, SQL SPID, and the calling app_name (which shows the application name of the SQL client that is connected to the Dedicated SQL Pool). When running SQL queries on a Dedicated SQL Pools database using Synapse Studio, I noticed that the app_name column had a JSON string with an app_name of SynapseSqlEditor and a script_name of SQL Dedicated Multi-Column. This looked familiar…let’s jump into Synapse Studio.
Synapse Studio Scripts
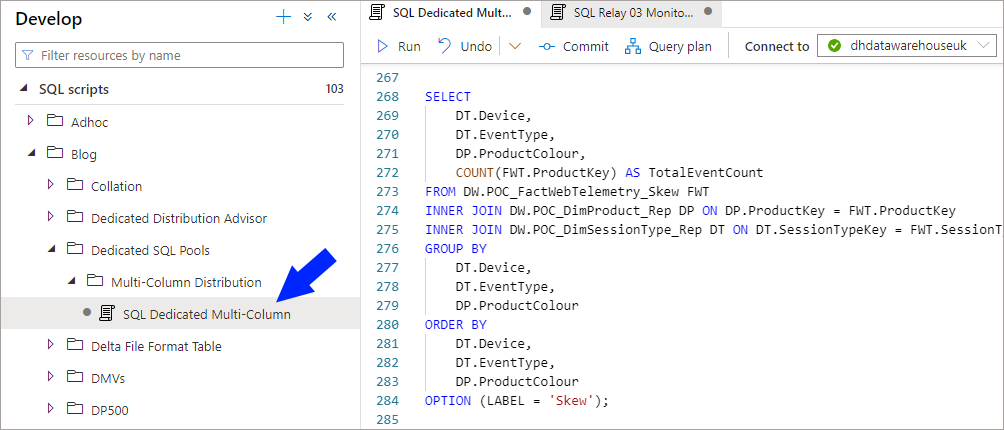
In Synapse Studio we are able to create SQL script files in the Develop tab (alongside Spark notebooks, Dataflows and KQL scripts). In this example I have a SQL script file called SQL Dedicated Multi-Column which has several SQL statements in (all have labels…I promise).
Now when I run a SELECT on the sys.dm_pdw_exec_sessions DMV I can see the app_name of SynapseSqlEditor and the script name of SQL Dedicated Multi-Column.
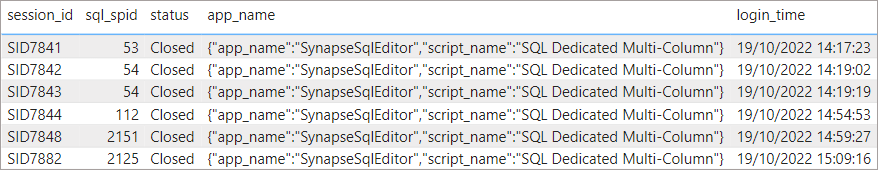
The script name is actually referencing the name of the script file in Synapse Studio, which I thought was very handy. Now, we are able to add a label to SQL queries using the OPTION keyword (Richard Munn talks about labels here) which is essential when tracking SQL queries, but at the session level it’s useful to know where the SQL script being executed comes from (because sometimes labels are not always added to queries….).
By putting the app_name information from dm_pdw_exec_sessions together with the query information from sys.dm_pdw_exec_requests we can build up a picture of which SQL statement has been run from which script file in Synapse Studio.
--show sessions and requests
SELECT
    ses.session_id,
    ses.status as session_status,
    ses.login_name,
    ses.login_time,
    ses.app_name,
    req.request_id,
    req.status AS request_status,
    req.submit_time,
    req.start_time,
    req.total_elapsed_time,
    req.[label] as query_label,
    req.command,
    req.resource_class
FROM sys.dm_pdw_exec_sessions ses
LEFT JOIN sys.dm_pdw_exec_requests req ON req.session_id = ses.session_id
WHERE app_name LIKE '%SynapseSqlEditor%'
ORDER BY
    ses.login_time DESC,
    req.submit_time DESC
Example Report Showing DMV Information
In this in-progress Power BI report, the sys.dm_pdw_exec_sessions (parent) and sys.dm_pdw_exec_requests (child) DMVs are being queried, and we can show both the app_name from sessions and SQL query information from requests.
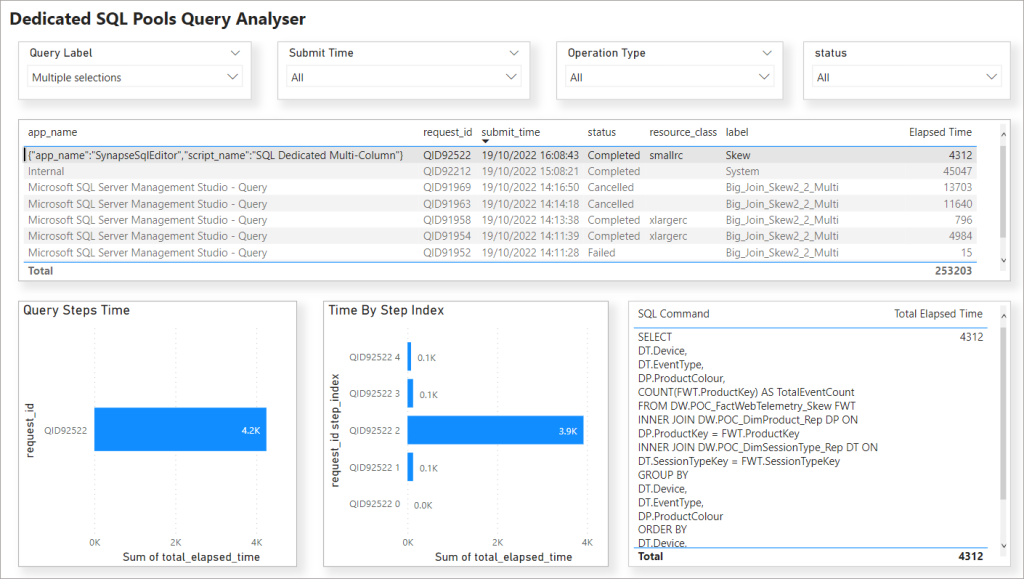
Hopefully a handy quick tip for anyone wishing to track SQL script activity in Dedicated SQL Pools if querying from Synapse Studio. I’ll upload the Power BI Query Analyser report onto GitHub once V1 is finished.
References
- System views for dedicated SQL pool (formerly SQL DW) – Azure Synapse Analytics | Microsoft Learn
- sys.dm_pdw_exec_sessions (Transact-SQL) – SQL Server | Microsoft Learn
- Monitor your dedicated SQL pool workload using DMVs – Azure Synapse Analytics | Microsoft Learn
- sys.dm_pdw_exec_requests (Transact-SQL) – SQL Server | Microsoft Learn
 Andy
Andy