

Well this new Explore This Data (link) feature in Power BI surprised me, both in terms of usefulness and in how much I’m currently using it. I don’t usually spend a lot of time on the reporting and visualisation aspect of Power BI. The only story-telling my reports and graphs do is to tell a story of how the person who built the report doesn’t know how to! 🙂 However, there was a new feature released recently that piqued my interest…a way to simply visualise data without that much effort? Yes please!
Explore This Data
Explore This Data is perfect for me, someone who spends most of the time with the data layer, data warehousing, data engineering, up to the semantic model. Yes, I can open a report and start to create visuals but sometimes I just need something very simple I can click and start getting data back very easily.
A perfect tool for the Data Engineer? Let’s find out…
Caveats
- Can only save to a workspace in a Premium capacity
- Explore authors need build permissions on the semantic model
- Users need a Pro/PPU license to share and the user being shared to needs build permissions to (yes…build permissions!)
With these caveats at the moment, the Explore feature wouldn’t work for “business” users who wanted a quick look at data in a semantic model, unless they were granted build rights. Build rights? We’ve been here before…
Walkthrough
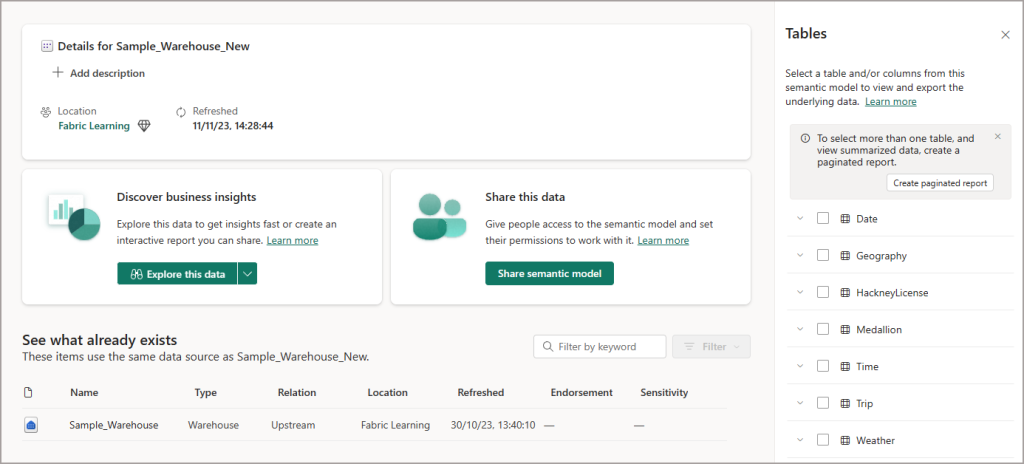
Click on a Semantic Model in a Workspace and you’ll see an option to Explore this data, the drop-down will give you an option to create a full-blown report…but usually I don’t need to do that. You can also click the semantic model quick menu (ellipsis) in a Workspace item list and select Explore this data (preview) too.
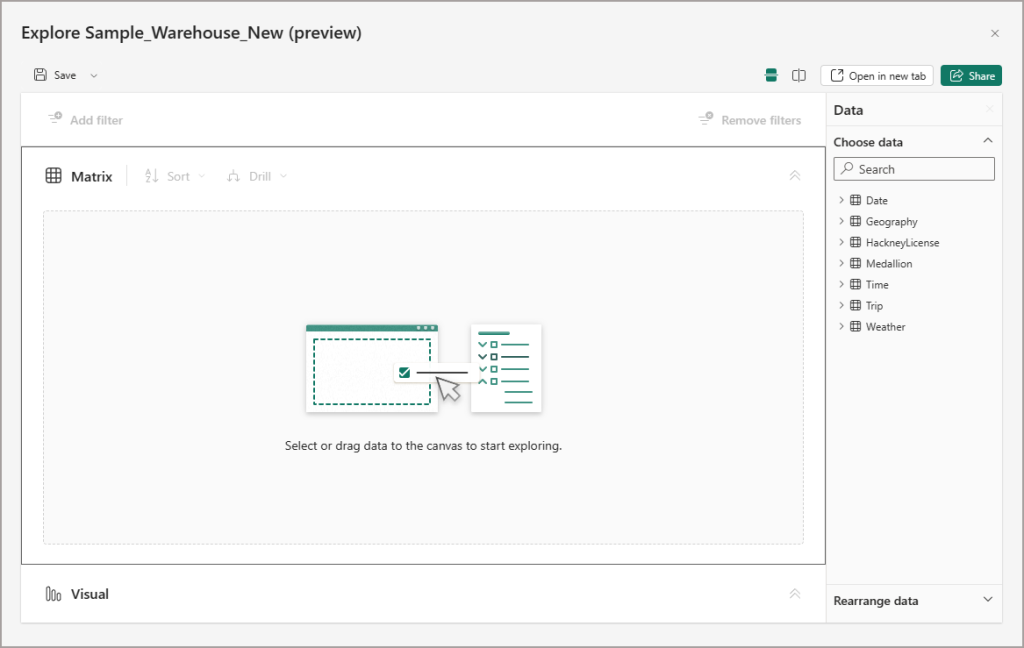
From the resultant pop-up we can now see a default Matrix view, which you cannot change. It always stays as a matrix (I like that, keep it simple). We don’t have a lot of options here, we can:
- Add Filters to the Add Filter area
- Add fields from the right hand side to the matrix and move to rows/columns
- Show the Visual window which shows a bar chart as default, this can be changed. Note that this visual simply displays what is in the matrix, it is not a separate visual
- Use the horizontal/vertical toggle in the top right to display the Visual underneath or to the right of the Matrix
- Save the exploration to a workspace
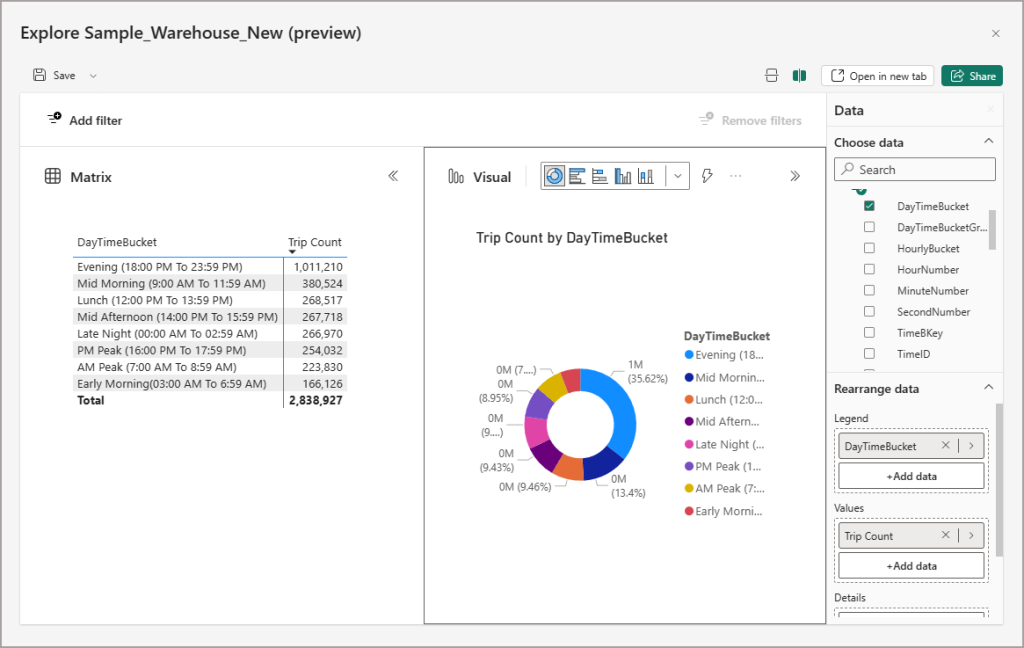
In this example, I’m using the sample Fabric Warehouse model which contains Taxi trip data. All I need to do is select the Trip Count measure and the Hourly Bucket field and I’ve got a table of data and a visual underneath, simple.
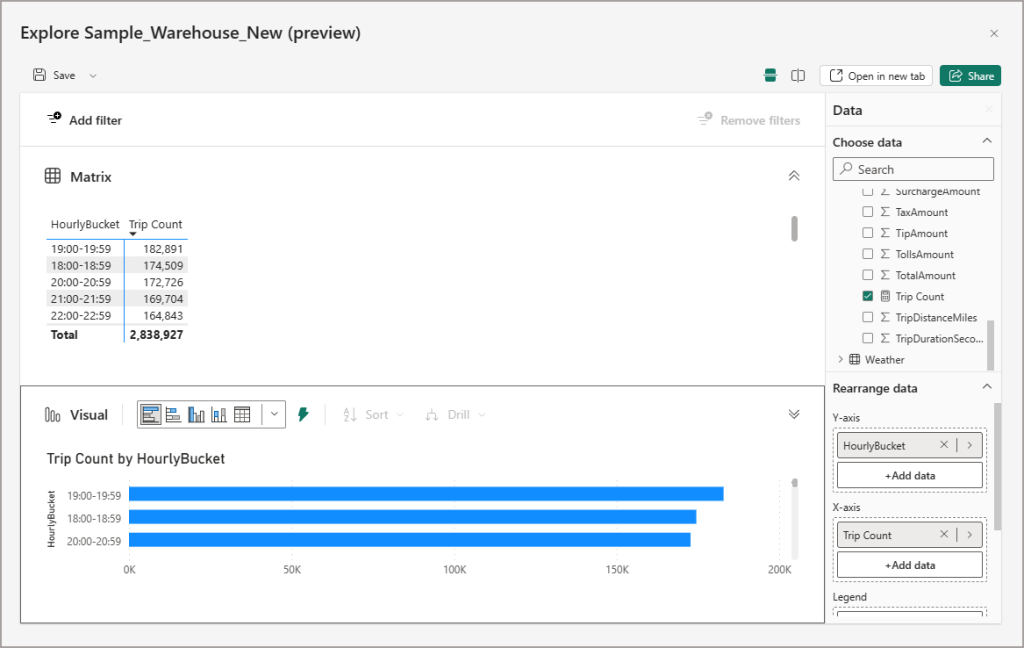
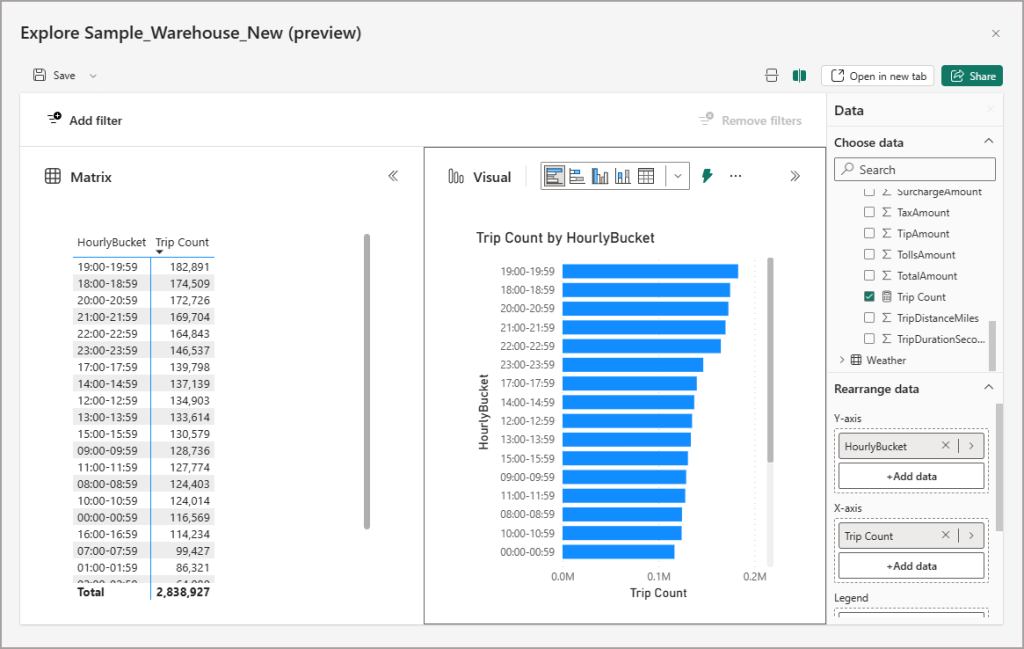
I can hit the toggle in the top right to switch the visual to the right side of the matrix. I’ve noted that on some visuals I’m unable to choose how it’s sorted. E.G in the bar chart below I couldn’t select how to sort, it just defaulted to sorting by the measure. Also, note the lightning button, this resets the visual back to default (no, it’s nothing to do with Data Activator).
Hey look, it’s a Donut Chart! Again, its very simple to change the type of visual using a basic on-object implementation. So if I want to change how the matrix is being viewed from a bar/column to a line, pie, scatter plot etc I can do that.
Save the Exploration
What’s interesting is that when saving, it doesn’t save it as a report, but rather an Exploration. So these items sit alongside all the other Fabric/Power BI items in a workspace. Explorations can be opened, edited, and shared. Fingers crossed they get added to the supported items in Git soon.
Differences with Fabric SQL Endpoint Explore Data
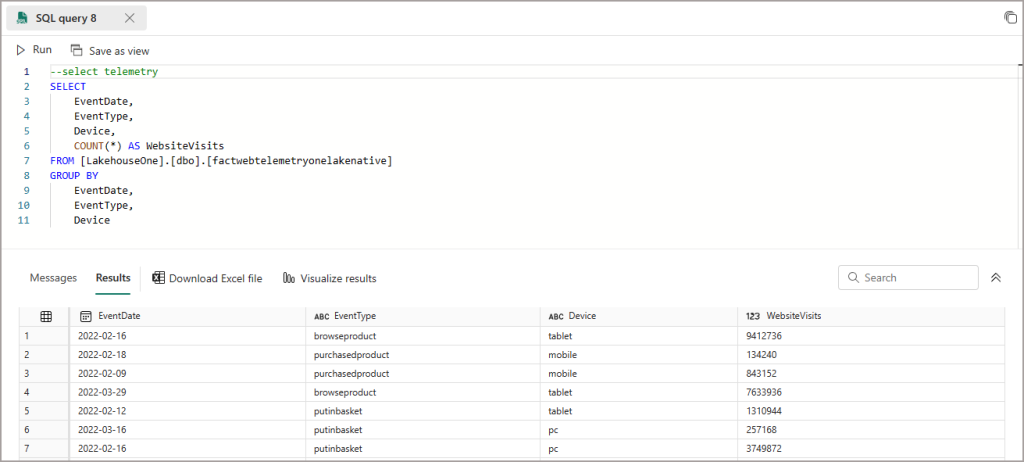
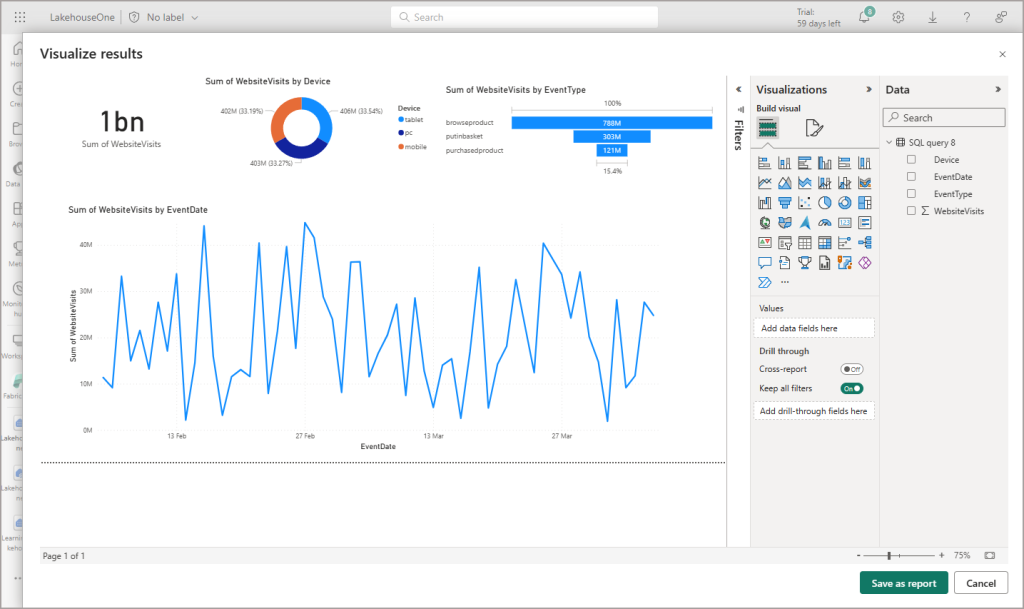
Now, there is another quick visualisation feature which on first glance looks like the Explore this data, but with some differences. When you are working with a Fabric Lakehouse SQL Endpoint or a Warehouse and are running SQL queries, you’ll see an option to Visualize results when you run the SQL query.
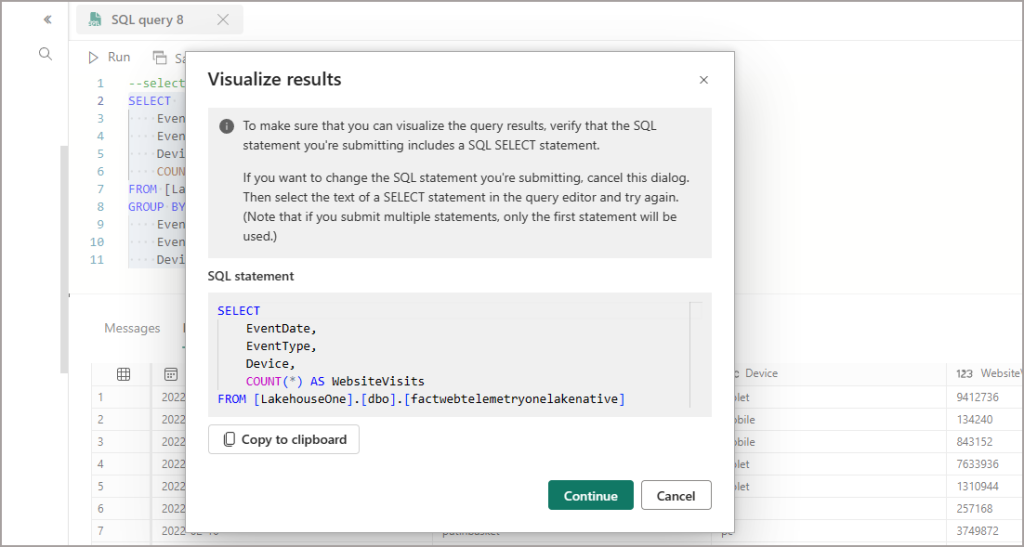
If you click the Visualize results button, it’ll ask you to select/highlight a SQL query from the current query window to run. It’ll then bring up a dialog to ask whether you have actually highlighted a SELECT statement.
Now when the window pops up to create a report, it brings up a more “complete” Power BI report authoring experience, yes it’s missing a lot of the desktop/web authoring features but it’s a lot more involved than the Explore this data feature. Interesting… a half-way house.
When you save this, it’s actually a report that’s being saved rather than an exploration.
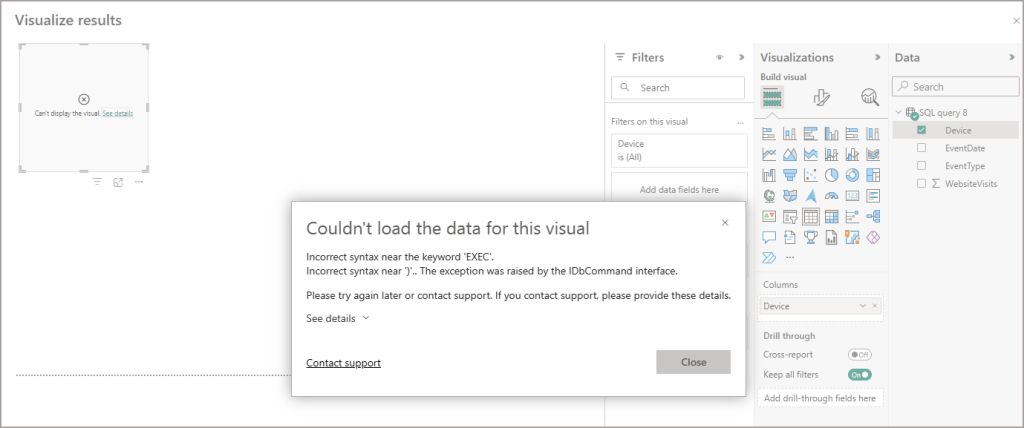
I did try and use the results of an EXEC storedprocedure command which returns rows and although it did being up the report window, it results in an error when I try and use any of the fields:
Conclusion
I like it, I really do. Simple and effective and gets me to the data in a semantic model very quickly and simply. I would like to see the feature being made available to users without build access, perhaps with another permission which allows them to use the Explore this data feature.
 Andy
Andy