
This blog is marked as intermediate knowledge as an understanding of Serverless SQL Pools is preferable, but not essential. Refer to Getting Started with Serverless SQL Pools to understand the service and how to setup a Serverless database. To work along with the tutorial, access to Azure and the ability to create a Log Analytics workspace is required.
Overview
In a previous blog post, we looked at how to setup and use Azure Storage Logs to analyse the folders and files in an Azure Data Lake Gen2 account that Synapse Analytics Serverless SQL Pools scanned when SQL queries were run. In that blog we looked at how to setup logging in Azure Storage, run SQL queries in Serverless SQL Pools over data stored in Azure Data Lake Gen2, then analyse the JSON logs to see which folders and files were scanned when reading data. Analysing the folders and files being processed by Serverless SQL Pools is useful when wanting to know if SQL queries are successfully using partition pruning (only scanning folders and files required by any filters in the SQL query).
However, this setup while useful, stores the logs in an Azure Storage account which must then be accessed and read. For enterprise-wide logging, we can use Log Analytics as a central logging and log analysis service for Azure services.
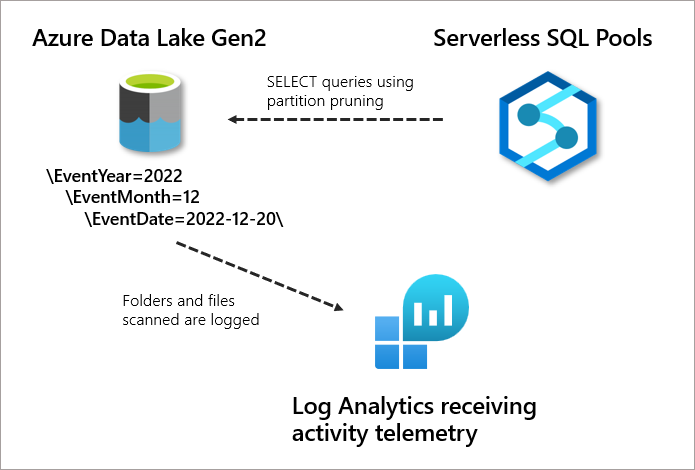
We’ll be looking at how to use Azure Log Analytics to analyse Serverless SQL Pools and Azure Data Lake Gen2 activity
In this blog post we’ll be looking at how to use Azure Log Analytics to analyse the activity on an Azure Data Lake Gen2 account when being queried by Serverless SQL Pools. This will include how to set up a Log Analytics workspace and then enable logging from an Azure Data Lake Gen2 account.
Pricing
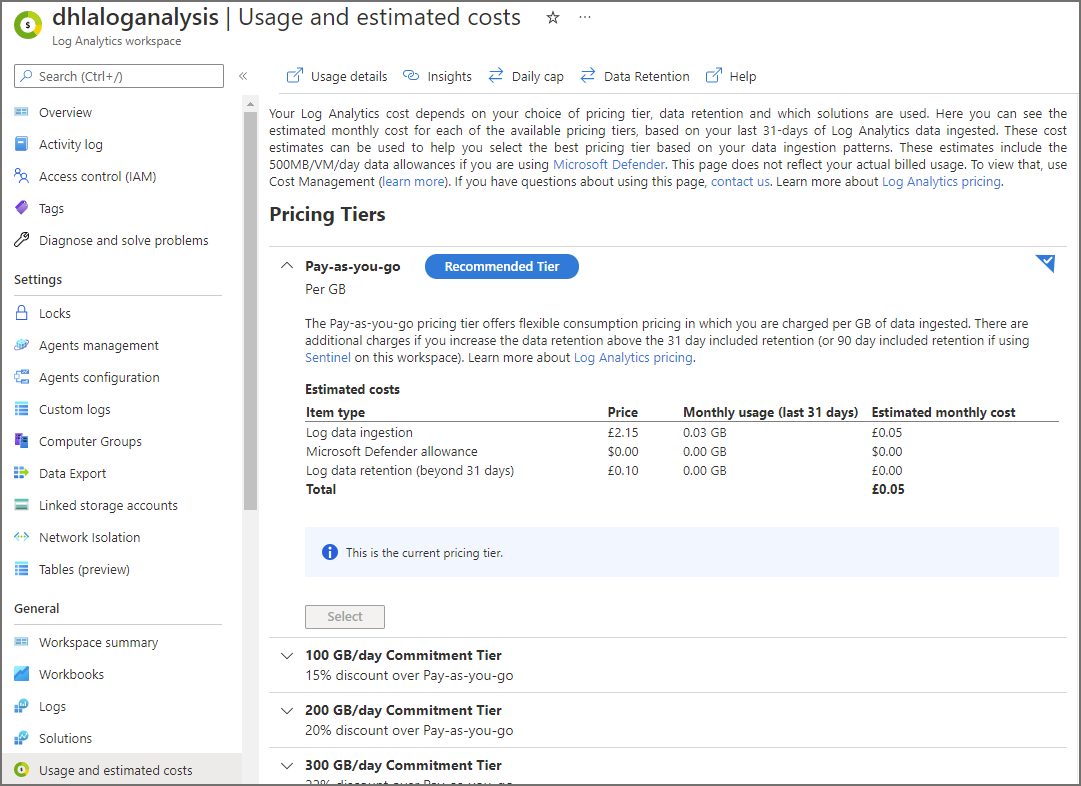
Azure Log Analytics pricing is available here and is based on the volume of log data ingested and stored. In each Log Analytics workspace is the ability to view the current and estimated costs by clicking the Usage and estimated costs under the General area. This will be available once a Log Analytics workspace is setup, which is the first step in the tutorial.
Setting up a Log Analytics Workspace
We’ll now setup a new Log Analytics workspace, please note that we can create multiple Log Analytics workspaces in an Azure Subscription.
- Log into https://portal.azure.com
- Search for Log Analytics and then click on Log Analytics Workspaces in the search results.
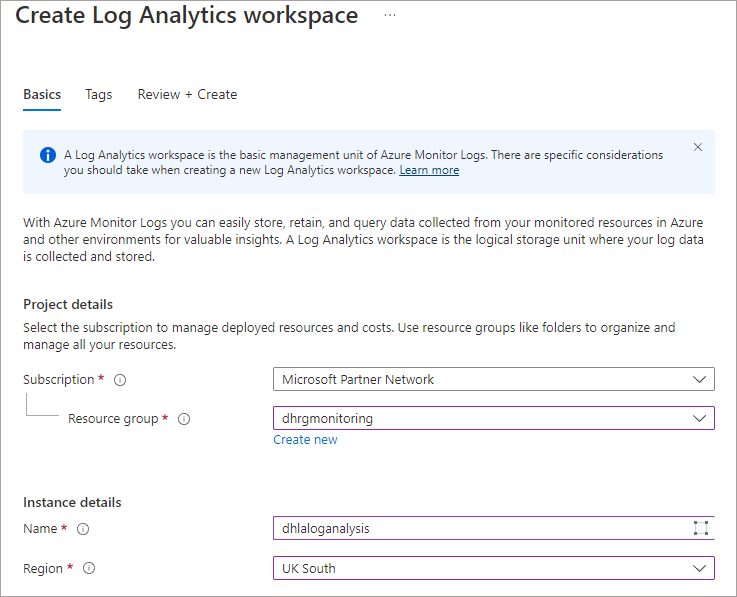
- Click on Create and enter the following information:
- Choose Subscription
- Select an existing Resource Group, or create a new one.
- Provide a Name for the Log Analytics workspace
- Select an appropriate Region
- Then click Review + Create
Once the Log Analytics workspace has been created, we can now configure an Azure Data Lake Gen2 account to send logs to this Log Analytics workspace.
Setting up Azure Storage Logging
We’ll now walk-through setting up logging on an Azure Data Lake Gen2 account that is being used to store Web Telemetry data in Parquet file format., Then generate activity by running SQL queries in Serverless SQL Pools, and analysing the logs in Log Analytics using a language called KQL, which we’ll discuss later in this blog.
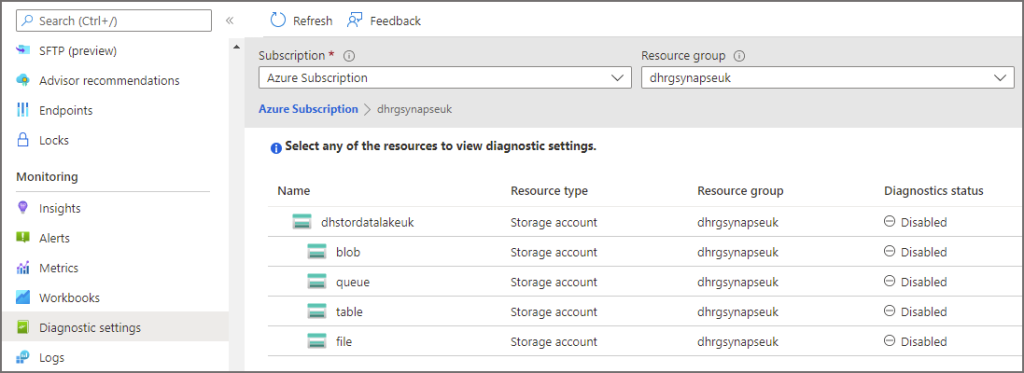
- In the Azure portal, browse to a relevant Azure Data Lake Gen2 account. Click on Diagnostics settings in the Monitoring section in the left menu.
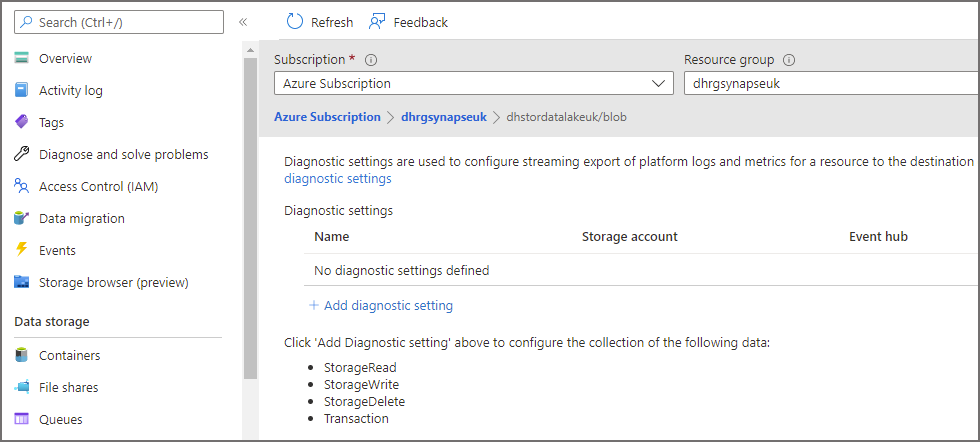
Click on blob under the storage account name in the tree list and then click Add Diagnostic Setting.
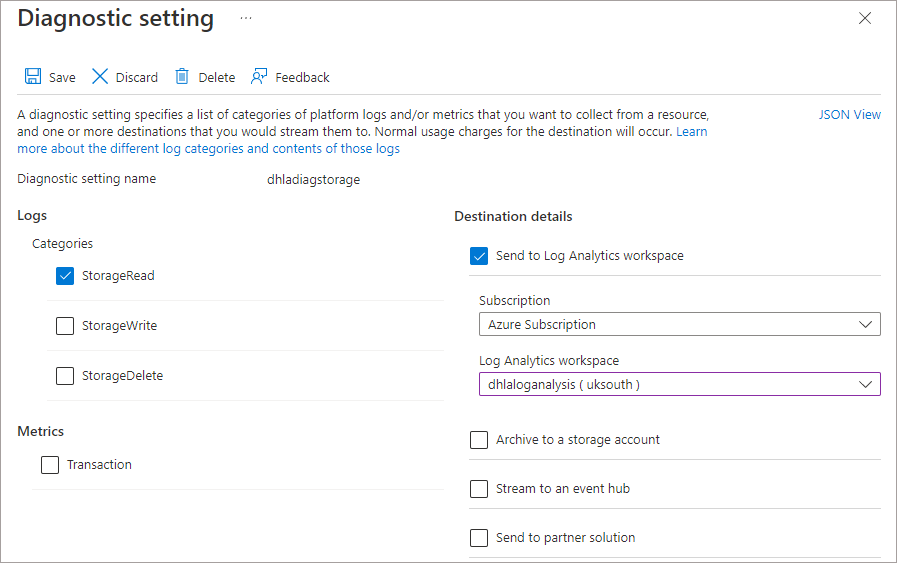
Enter the following information in the diagnostics window.
- Enter a name for the diagnostic setting
- Enable StorageRead under Logs Categories (you can also enable StorageWrite if you are writing data back to the Data Lake using Serverless SQL Pools)
- Select Send to Log Analytics workspace and select the relevant Subscription and Log Analytics workspace created in the step earlier
- Click Save
Now that we’ve configured the Azure Data Lake Gen2 account for logging and read activity, we can now generate activity using Serverless SQL Pools queries and see the results in the logs.
Run Queries in Serverless SQL Pools
This section of the blog is identical in the Use Azure Storage Logs… as we are generating the same activity in SQL with Serverless SQL Pools.
We’ll now create a View in a Serverless SQL Pools database which includes 3 columns that use the filepath function (more info here) , we can use these columns to partition prune and only process data in folders we specify in the WHERE clause. The logs should show folders that have been queried when a SQL query by Serverless is issued.
The dataset used is ~1billion rows of Web Telemetry data from 09/2021 to 12/2021.
Create View
In the following View definition the OPENROWSET command is pointed toward Web Telemetry event data stored as Parquet file format in a folder partition format \EventYear=YYYY\EventMonth=MM\EventDate=YYYY-MM-DD\. The * wildcards in the BULK statement will be returned as the FolderEventYear, FolderEventMonth, and FolderEventDate columns in the view, allowing the use of filters in the WHERE clause. Please note that there are 3 other date fields, EventYear, EventMonth, and EventDate – these columns are actual data stored in the source Parquet files. We’ll use these columns to illustrate the difference when filtering data using the filepath columns and using columns within the Parquet files themselves.
A Serverless SQL Pools database has already been created and a data source added to point towards the Azure Data Lake Gen2.
--create a view over data lake data
CREATE VIEW LDW.vwWebTelemetryParquet
AS
SELECT
    UserID,
    EventType,
    ProductID,
    [URL] AS ProductURL,
    Device,
    SessionViewSeconds,
    FilePathYear AS EventYear,
    FilePathMonth AS EventMonth,
    FilePathDate AS EventDate,
    CAST(fct.filepath(1) AS SMALLINT) AS FolderEventYear,
    CAST(fct.filepath(2) AS TINYINT) AS FolderEventMonth,
    CAST(fct.filepath(3) AS DATE) AS FolderEventDate
FROM
 OPENROWSET
(
    BULK 'cleansed/webtelemetry/EventYear=*/EventMonth=*/EventDate=*/*.parquet',
    DATA_SOURCE = 'ExternalDataSourceDataLakeMI',
    FORMAT = 'Parquet'
)
WITH
(
    UserID INT,
    EventType VARCHAR(50),
    EventDateTime DATE,
    ProductID SMALLINT,
    URL VARCHAR(50),
    Device VARCHAR(10),
    SessionViewSeconds INT,
    FilePathYear SMALLINT,
    FilePathMonth TINYINT,
    FilePathDate DATE
) AS fct;
Now that a view has been created, we can start running queries. We’ll run 3 queries and then analyse the logs afterward.
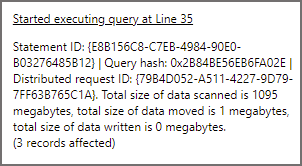
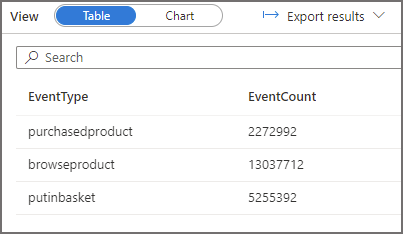
Query 1: Run Query with No Partition Pruning
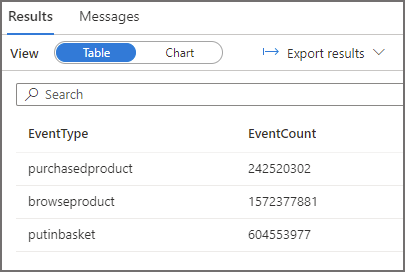
This query will aggregate events by the event type column, it has no filter so we expect all data in the cleansed/webtelemetry folder to be read. The result statistics image below shows 1095MB scanned, take a note of this total as we can also obtain this from the Log Analytics logs.
--select all data
SELECT
    EventType,
    COUNT(*) AS EventCount
FROM LDW.vwWebTelemetryParquet
GROUP BY
    EventType
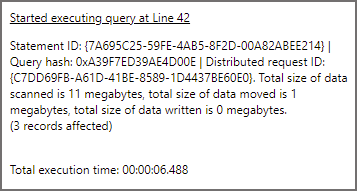
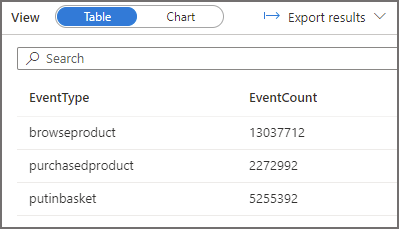
Query 2: Run Query with Partition Pruning
We’ll now run a query where we select data and use a column, FolderEventDate, that is the result of the filepath function, in the WHERE clause to only read data from the 2021-12-02 folder. In the logs we should see Serverless SQL Pools has scanned only 1 of the folders. The result statistics image below shows 11MB scanned.
--filter using the filepath column FolderEventDate
SELECT
    EventType,
    COUNT(*) AS EventCount
FROM LDW.vwWebTelemetryParquet
WHERE FolderEventDate = '2021-10-02'
GROUP BY
    EventType
Query 3: Run Query with Filter but no Partition Pruning
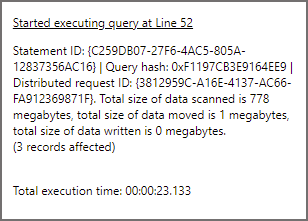
This query is going to filter the data and provide the same results as above except we’re not using the FolderEventDate (filepath function) column , we’re using a column in the parquet data itself. When we run this query, it will need to scan all the folders before returning the same dataset. In the logs we should see Serverless SQL Pools has scanned all the folders. The result statistics image below shows 778MB scanned.
SELECT
    EventType,
    COUNT(*) AS EventCount
FROM LDW.vwWebTelemetryParquet
WHERE EventDate = '2021-10-02'
GROUP BY
    EventType
Now that we’ve run the 3 SQL queries from Serverless SQL Pools against data in Azure Data Lake Gen2, we can now analyse the logs using Log Analytics.
Analysing Log Files
In this section we’ll now open Log Analytics and run KQL queries to return log information about which folders and files were scanned during the running of the 3 SQL queries in the previous section.
KQL for Querying Log Data
KQL (Kusto Query Language) is the language used to query Log Analytics, there’s a getting started with KQL article here if you’d like to know more. In the scope of this blog we’ll run a few KQL queries to see the activity on the Azure Data Lake Gen2 account.
Using Log Analytics to Query Logs
Let’s now open Log Analytics and start running KQL queries.
- Open https://portal.azure.com
- Search for Log Analytics and click on Log Analytics workspaces
- Click on the workspace that was created earlier
- Under the General section, click Logs
- If any pop-ups appear, click the X in the top right of the popup
- You should now be able to see the query window similar to the following image
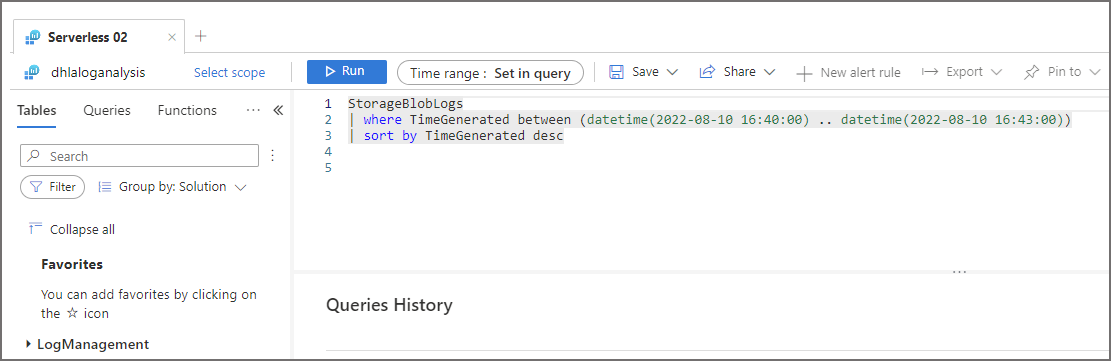
We can use a simple KQL query to analyse the StorageBlobLogs table in Log Analytics that stores the read events on the Azure Data Lake Gen2 account we configured earlier. The following KQL query limits the timeframe to analyse when the first aggregate SQL query ran.
//generate a simple list of all events from the data lake
StorageBlobLogs
| where TimeGenerated between (datetime(2022-08-10 16:40:00) .. datetime(2022-08-10 16:43:00))
| where UserAgentHeader contains "SQLBLOBACCESS"
| sort by TimeGenerated desc
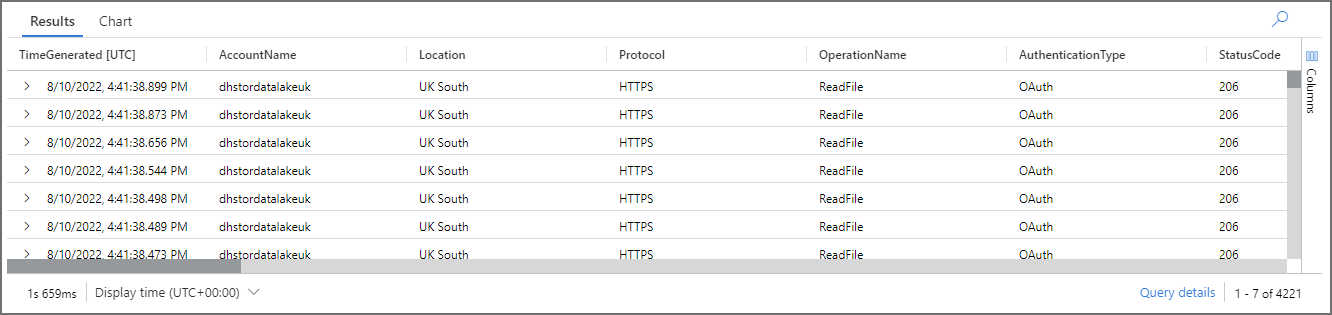
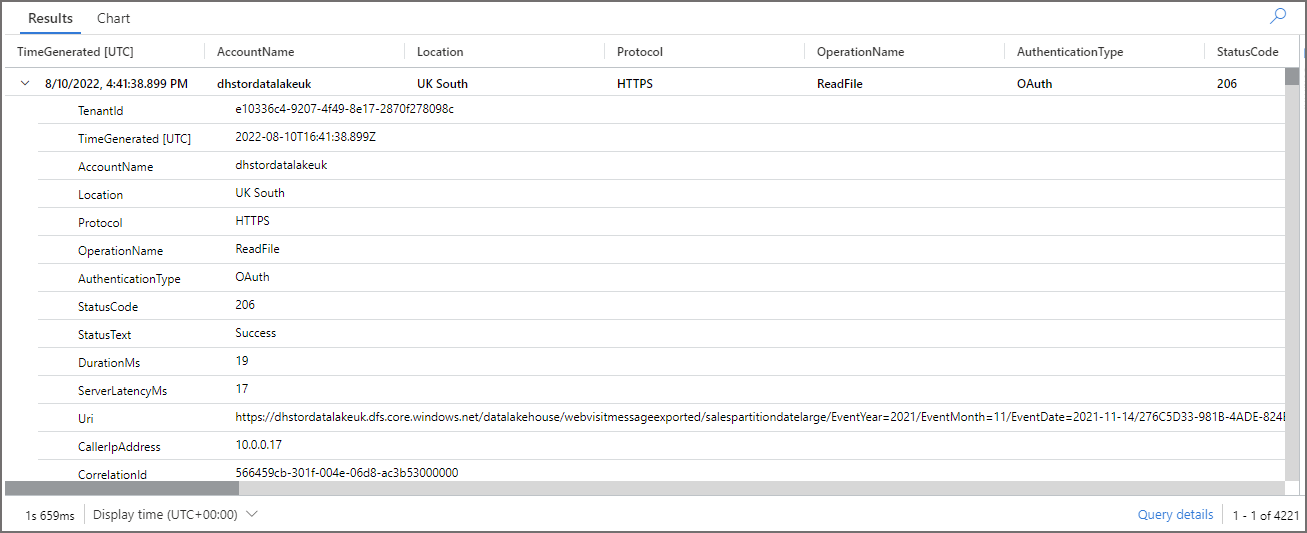
The image above is just a subset of the available columns, if you click the arrow to the left of each row you can see more details. The relevant field is Uri which shows the folder and files that were scanned by Serverless SQL Pools.
In the following KQL queries we can see the number of files scanned when running the 3 SQL queries in Serverless SQL Pools. What’s interesting is we can add the CallerIpAddress field in the aggregate query to see the compute that Serverless SQL Pools used to run the queries and how the files scanned were distributed.
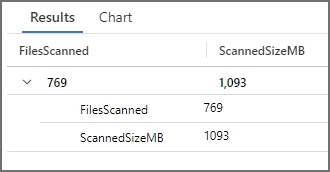
//run an aggregate query to calculate how many files were scanned and the total body size in MB
StorageBlobLogs
| where TimeGenerated between (datetime(2022-08-10 16:40:00) .. datetime(2022-08-10 16:43:00))
| where UserAgentHeader contains "SQLBLOBACCESS"
| where Uri contains "webvisitmessage"
| summarize FilesScanned=dcount(Uri),ScannedSizeMB=sum(ResponseBodySize)/1024/1024
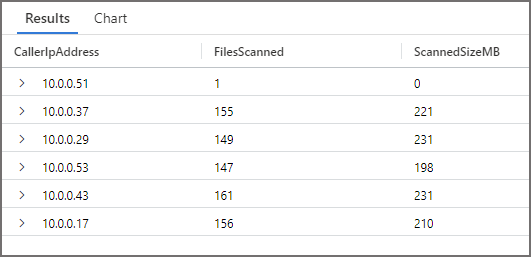
//run an aggregate query and group by the CallerIpAddress
StorageBlobLogs
| where TimeGenerated between (datetime(2022-08-10 20:54:00) .. datetime(2022-08-10 20:57:00))
| where UserAgentHeader contains "SQLBLOBACCESS"
| where Uri contains "webvisitmessage"
| summarize FilesScanned=dcount(Uri),ScannedSizeMB=sum(ResponseBodySize)/1024/1024 by CallerIpAddress
I’ll run the KQL queries above 3 times to see how many files were scanned when each of the 3 SQL aggregate queries were run. For reference, there are 768 files in total in the Azure Data Lake Gen2 account.
Query 1: Run Query with No Partition Pruning Results
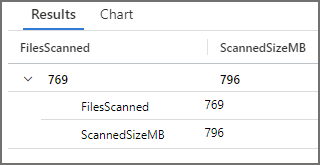
We can see that 769 files were scanned and a total of 1,093MB was scanned, which is similar to the results in Serverless SQL Pools. What’s interesting is when grouping by CallerIpAddress we can see multiple compute resources running the query, the workload to scan the files is being distributed.
We can visualise the results above in a chart. To see the distribution of the files scanned by Serverless SQL Pools IPAddress, click the Chart tab after running a KQL query and set a Chart type, Category, and Value.
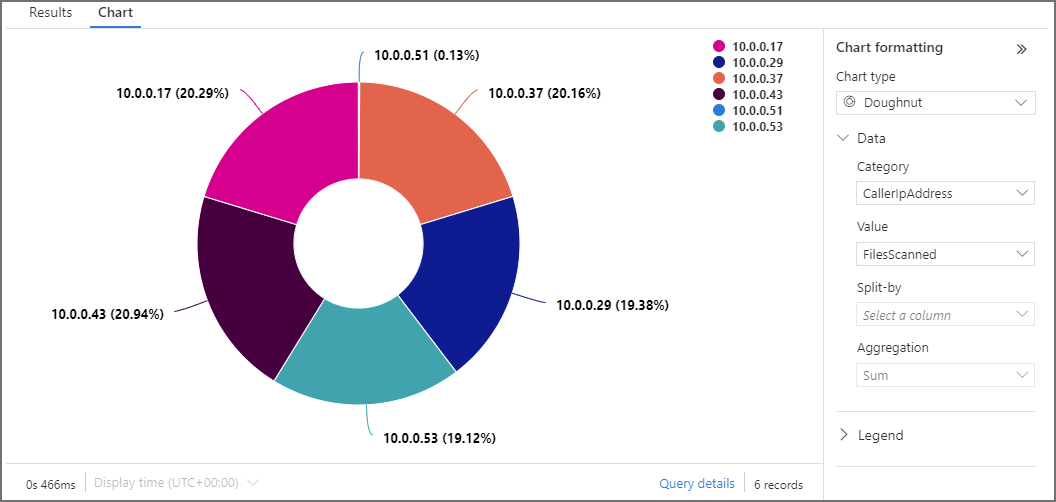
There is also the ability to export the KQL query as Power BI M code, for use within Power BI itself. To do this, in the Log Analytics query window click Export > Export to Power BI (M Query). There is more information about Power BI integration here.
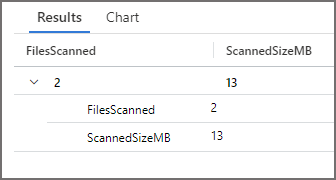
Query 2: Run Query with Partition Pruning Results
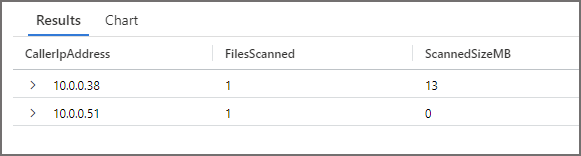
When we run the SQL query that uses the filepath() function in Serverless SQL Pools to partition prune, we can see that the number of files scanned and MB size scanned is reduced significantly. This shows that partition pruning has been successful.
Query 3: Run Query with Filter but no Partition Pruning Results
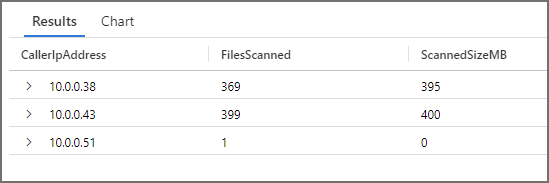
The last aggregate SQL query returns the exact same resultset, but this time uses a column within the underlying data itself to filter. As this column is not a data lake folder partition column, all of the files have been scanned and then filtered. This is inefficient as no partition pruning was activated.
Conclusion
In this blog we’ve walked through the process of creating a Log Analytics workspace, generating query activity using Serverless SQL Pools on a monitored Azure Data Lake Gen2 account, and then queried the logs so see usage. Log Analytics is a useful service to centralise logging on many different Azure services and be able to query and combine log queries across these services.
In a future blog we’ll dive more into Log Analytics and KQL when working with Azure Synapse Analytics.
References
- https://github.com/microsoft/Azure_Synapse_Toolbox
- https://docs.microsoft.com/en-us/azure/storage/blobs/monitor-blob-storage?tabs=azure-portal
- How to monitor Synapse Analytics using Azure Monitor – Azure Synapse Analytics | Microsoft Docs
- Log Analytics integration with Power BI and Excel – Azure Monitor | Microsoft Docs
- https://docs.microsoft.com/en-us/azure/azure-monitor/logs/log-analytics-overview
 Andy
Andy
[…] check what folders are being scanned in the Azure storage account when running queries. There is a blog here detailing how to set this […]